
Page 247 - Çevre Şehir İklim İngilizce - Sayı 3
P. 247
Gül Aslı Aksu
3. Findings
The findings obtained from the analyses within the scope of the research
were evaluated under two headings.
3.1. Findings of Surface Runoff Risk Analysis
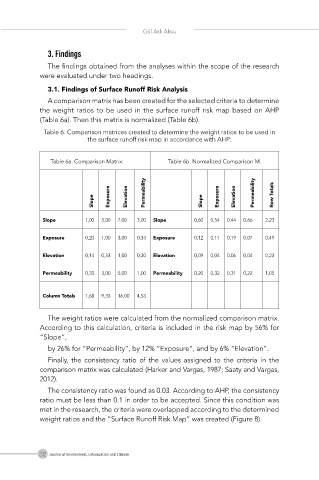
A comparison matrix has been created for the selected criteria to determine
the weight ratios to be used in the surface runoff risk map based on AHP
(Table 6a). Then this matrix is normalized (Table 6b).
Table 6. Comparison matrices created to determine the weight ratios to be used in
the surface runoff risk map in accordance with AHP:
Table 6a. Comparison Matrix: Table 6b. Normalized Comparison M.
Permeability Permeability Row Totals
Slope Exposure Elevation Slope Exposure Elevation
Slope 1,00 5,00 7,00 3,00 Slope 0,60 0,54 0,44 0,66 2,23
Exposure 0,20 1,00 3,00 0,33 Exposure 0,12 0,11 0,19 0,07 0,49
Elevation 0,14 0,33 1,00 0,20 Elevation 0,09 0,04 0,06 0,04 0,23
Permeability 0,33 3,00 5,00 1,00 Permeability 0,20 0,32 0,31 0,22 1,05
Column Totals 1,68 9,33 16,00 4,53
The weight ratios were calculated from the normalized comparison matrix.
According to this calculation, criteria is included in the risk map by 56% for
“Slope”,
by 26% for “Permeability”, by 12% “Exposure”, and by 6% “Elevation”.
Finally, the consistency ratio of the values assigned to the criteria in the
comparison matrix was calculated (Harker and Vargas, 1987; Saaty and Vargas,
2012).
The consistency ratio was found as 0.03. According to AHP, the consistency
ratio must be less than 0.1 in order to be accepted. Since this condition was
met in the research, the criteria were overlapped according to the determined
weight ratios and the “Surface Runoff Risk Map” was created (Figure 8).
232 Journal of Environment, Urbanization and Climate