
Page 242 - Çevre Şehir İklim İngilizce - Sayı 3
P. 242
Evaluation of Surface Runoff Risk in The Frame of Landscape Pattern:
The Case of Kastamonu Central District
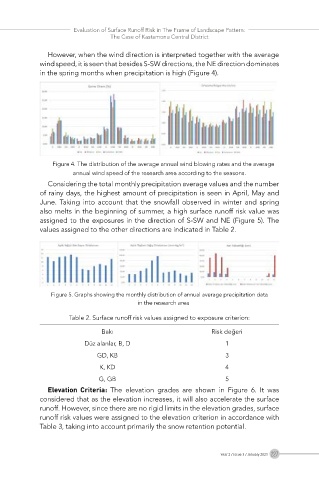
However, when the wind direction is interpreted together with the average
wind speed, it is seen that besides S-SW directions, the NE direction dominates
in the spring months when precipitation is high (Figure 4).
Figure 4. The distribution of the average annual wind blowing rates and the average
annual wind speed of the research area according to the seasons.
Considering the total monthly precipitation average values and the number
of rainy days, the highest amount of precipitation is seen in April, May and
June. Taking into account that the snowfall observed in winter and spring
also melts in the beginning of summer, a high surface runoff risk value was
assigned to the exposures in the direction of S-SW and NE (Figure 5). The
values assigned to the other directions are indicated in Table 2.
Figure 5. Graphs showing the monthly distribution of annual average precipitation data
in the research area
Table 2. Surface runoff risk values assigned to exposure criterion:
Bakı Risk değeri
Düz alanlar, B, D 1
GD, KB 3
K, KD 4
G, GB 5
Elevation Criteria: The elevation grades are shown in Figure 6. It was
considered that as the elevation increases, it will also accelerate the surface
runoff. However, since there are no rigid limits in the elevation grades, surface
runoff risk values were assigned to the elevation criterion in accordance with
Table 3, taking into account primarily the snow retention potential.
Year 2 / Issue 3 / January 2023 227