
Page 246 - Çevre Şehir İklim İngilizce - Sayı 3
P. 246
Evaluation of Surface Runoff Risk in The Frame of Landscape Pattern:
The Case of Kastamonu Central District
et al., 2011; Vaz et al., 2014; Liu, 2017; Sertel et al., 2018; Ozcan et al., 2019; Li
et al., 2019; Abedini et al.,2020; Wolff and Lakes, 2020; Wolff et al., 2021; Zhang et
al., 2022; Bao and Yang, 2022).
Spatial measurements can characterize urban forms. They provide an
opportunity to evaluate the nature of changes in urban structure by representing
critical determinants such as shape, configuration and distribution in urban
landscape planning (Forman, 1995; Milleret al., 1998; Leitão et al., 2006;
Southworth et al., 2010; Fan and Myint, 2014; Liu and Yang, 2015; Szabó et
al., 2016; Prastacos et al., 2017). In order to analyze the landscape pattern,
appropriate landscape metrics should be preferred (Wang and Li, 2021). For
this reason, landscape metrics in the most suitable class level for the research
were selected among the “extremely universal and consistent landscape
structure components” defined by Cushman et al. (2008).
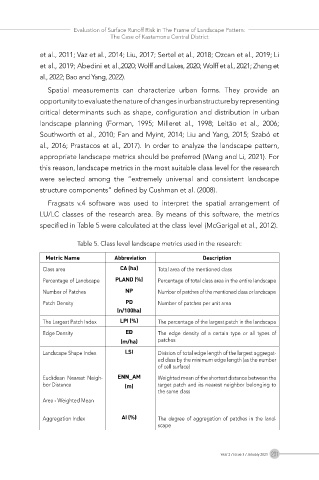
Fragsats v.4 software was used to interpret the spatial arrangement of
LU/LC classes of the research area. By means of this software, the metrics
specified in Table 5 were calculated at the class level (McGarigal et al., 2012).
Table 5. Class level landscape metrics used in the research:
Metric Name Abbreviation Description
Class area CA (ha) Total area of the mentioned class
Percentage of Landscape PLAND (%) Percentage of total class area in the entire landscape
Number of Patches NP Number of patches of the mentioned class or landscape
Patch Density PD Number of patches per unit area
(n/100ha)
The Largest Patch Index LPI (%) The percentage of the largest patch in the landscape
Edge Density ED The edge density of a certain type or all types of
(m/ha) patches
Landscape Shape Index LSI Division of total edge length of the largest aggregat-
ed class by the minimum edge length (as the number
of cell surface)
Euclidean Nearest Neigh- ENN_AM Weighted mean of the shortest distance between the
bor Distance (m) target patch and its nearest neighbor belonging to
the same class
Area - Weighted Mean
Aggregation Index AI (%) The degree of aggregation of patches in the land-
scape
Year 2 / Issue 3 / January 2023 231