
Page 249 - Çevre Şehir İklim İngilizce - Sayı 3
P. 249
Gül Aslı Aksu
Considering the fact that the areas covered with vegetation are also dense
in this region (Figure 7) it is seen that the areas covered with vegetation,
especially forests and shrubs, make an important contribution to reducing the
risk of surface runoff.
On the other hand, it is observed that the areas with a lower-medium risk
are mostly corresponded to agricultural lands and lowlands with relatively
lower degree of slope (Figures 2, 6 and 7). These areas are also concentrated
around the main deposits where precipitation waters are collected (Figure
8). It is understood that the fact that high and sloping areas are covered with
qualified vegetation makes a great contribution to the holding of precipitation
waters before acceleration. Otherwise, surface runoff waters from high and
inclined areas will accumulate at a higher rate in the beds, increasing the risk
ratio. This situation will trigger the risk that sudden and heavy rains will cause
floods, especially in the flow direction beds, including the city center.
Findings of Landscape Pattern Analysis
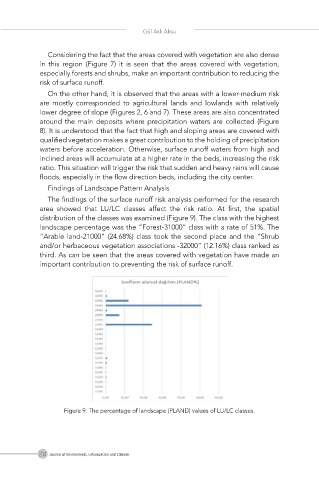
The findings of the surface runoff risk analysis performed for the research
area showed that LU/LC classes affect the risk ratio. At first, the spatial
distribution of the classes was examined (Figure 9). The class with the highest
landscape percentage was the “Forest-31000” class with a rate of 51%. The
“Arable land-21000” (24.68%) class took the second place and the “Shrub
and/or herbaceous vegetation associations -32000” (12.16%) class ranked as
third. As can be seen that the areas covered with vegetation have made an
important contribution to preventing the risk of surface runoff.
Figure 9. The percentage of landscape (PLAND) values of LU/LC classes.
234 Journal of Environment, Urbanization and Climate