
Page 250 - Çevre Şehir İklim İngilizce - Sayı 3
P. 250
Evaluation of Surface Runoff Risk in The Frame of Landscape Pattern:
The Case of Kastamonu Central District
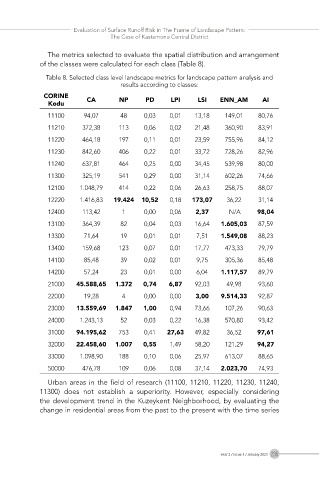
The metrics selected to evaluate the spatial distribution and arrangement
of the classes were calculated for each class (Table 8).
Table 8. Selected class level landscape metrics for landscape pattern analysis and
results according to classes:
CORINE CA NP PD LPI LSI ENN_AM AI
Kodu
11100 94,07 48 0,03 0,01 13,18 149,01 80,76
11210 372,38 113 0,06 0,02 21,48 360,90 83,91
11220 464,18 197 0,11 0,01 23,59 755,96 84,12
11230 842,60 406 0,22 0,01 33,72 728,26 82,96
11240 637,81 464 0,25 0,00 34,45 539,98 80,00
11300 325,19 541 0,29 0,00 31,14 602,26 74,66
12100 1.048,79 414 0,22 0,06 26,63 258,75 88,07
12220 1.416,83 19.424 10,52 0,18 173,07 36,22 31,14
12400 113,42 1 0,00 0,06 2,37 N/A 98,04
13100 364,39 82 0,04 0,03 16,64 1.605,03 87,59
13300 71,64 19 0,01 0,01 7,51 1.549,08 88,23
13400 159,68 123 0,07 0,01 17,77 473,33 79,79
14100 85,48 39 0,02 0,01 9,75 305,36 85,48
14200 57,24 23 0,01 0,00 6,04 1.117,57 89,79
21000 45.588,65 1.372 0,74 6,87 92,03 49,98 93,60
22000 19,28 4 0,00 0,00 3,00 9.514,33 92,87
23000 13.559,69 1.847 1,00 0,94 73,66 107,26 90,63
24000 1.243,13 52 0,03 0,22 16,38 570,80 93,42
31000 94.195,62 753 0,41 27,63 49,82 36,52 97,61
32000 22.458,60 1.007 0,55 1,49 58,20 121,29 94,27
33000 1.098,90 188 0,10 0,06 25,97 613,07 88,65
50000 476,78 109 0,06 0,08 37,14 2.023,70 74,93
Urban areas in the field of research (11100, 11210, 11220, 11230, 11240,
11300) does not establish a superiority. However, especially considering
the development trend in the Kuzeykent Neighborhood, by evaluating the
change in residential areas from the past to the present with the time series
Year 2 / Issue 3 / January 2023 235