
Page 193 - Çevre Şehir İklim İngilizce - Sayı 2
P. 193
Gizem Erdoğan - Serdar Simsar - Sinem Dudu Sakal - Ömer Kor - Gamze Kardoğan
Ceren Parıltı - Yaşar Doğukan Kaya - Begüm Gündoğdu
Yemişlik Neighborhoods. There seems to be lack of green areas that are important
for creating decreasing urban heat waves and creating public assembly areas.
With a focus on heat waves, the climatic features of Torbali district were also
evaluated. The settlement serves as a transition between Mediterranean and
Black Sea climates. There are three main types of weather in the area. These
are the weather masses from the north and the south, and clear weather. The
dominant climate in Torbalı settlement is the typical Mediterranean climate in
accordance with the climate of Izmir. It is hot and dry in summers, and warm and
rainy in winters. The hottest months are October and August, and the coolest
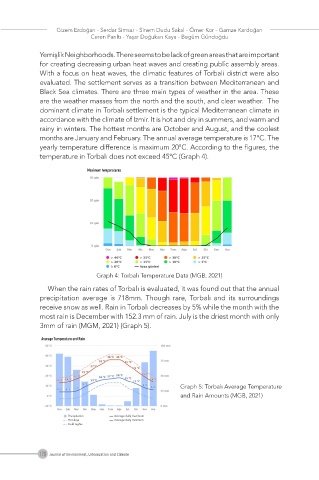
months are January and February. The annual average temperature is 17°C. The
yearly temperature difference is maximum 20°C. According to the figures, the
temperature in Torbalı does not exceed 45°C (Graph 4).
Maximum temperatures
Graph 4: Torbalı Temperature Data (MGB, 2021)
When the rain rates of Torbalı is evaluated, it was found out that the annual
precipitation average is 718mm. Though rare, Torbalı and its surroundings
receive snow as well. Rain in Torbalı decreases by 5% while the month with the
most rain is December with 152.3 mm of rain. July is the driest month with only
3mm of rain (MGM, 2021) (Graph 5).
Average Temperature and Rain
Graph 5: Torbalı Average Temperature
and Rain Amounts (MGB, 2021)
Precipitation Average daily maximum
Hot days Average daily minimum
Cold nights
179 Journal of Environment, Urbanization and Climate