Page 144 - 7. State Of Environment Report Of Türkiye
P. 144

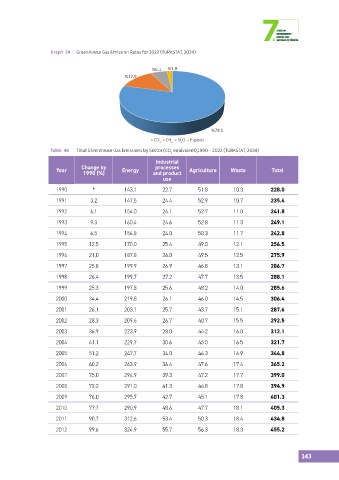
Graph  24  Greenhouse Gas Emission Rates for 2022 (TURKSTAT, 2024)

                                                      %6.1   %1.9
                                             %12.9


                                                                           %79.1
                                                       CO  CH  N O F-gases
                                                         2   4   2
                   Table  46  Total Greenhouse Gas Emissions by Sector (CO  equivalent),1990 - 2022 (TURKSTAT, 2024)
                                                             2
                                                        Industrial
                                                        processes
                     Year     Change by     Energy     and product   Agriculture  Waste         Total
                              1990 (%)
                                                          use
                     1990         *          143.1        22.7         51.8        10.3         228.0
                     1991        3.2         147.5        24.4         52.9        10.7         235.4

                     1992        6.1         154.0        24.1         52.7        11.0         241.8
                     1993        9.3         160.4        24.6         52.8        11.3         249.1
                     1994        6.5         156.8        24.0         50.3        11.7         242.8

                     1995       12.5         170.0        25.4         49.0        12.1         256.5
                     1996       21.0         187.8        26.0         49.5        12.5         275.9

                     1997       25.8         199.9        26.9         46.8        13.1         286.7
                     1998       26.4         199.7        27.2         47.7        13.5         288.1
                     1999       25.3         197.8        25.6         48.2        14.0         285.6

                     2000       34.4         219.8        26.1         46.0        14.5         306.4
                     2001       26.1         203.1        25.7         43.7        15.1         287.6

                     2002       28.3         209.6        26.7         40.7        15.5         292.5
                     2003       36.9         223.9        28.0         44.2        16.0         312.1
                     2004       41.1         229.7        30.6         45.0        16.5         321.7

                     2005       51.2         247.7        34.0         46.3        16.9         344.8
                     2006       60.2         263.9        36.4         47.6        17.4         365.2
                     2007       75.0         294.9        39.3         47.2        17.7         399.0

                     2008       73.2         291.0        41.3         44.8        17.8         394.9
                     2009       76.0         295.7        42.7         45.1        17.8         401.3

                     2010       77.7         290.9        48.6         47.7        18.1         405.3
                     2011       90.7         312.6        53.4         50.3        18.4         434.8
                     2012       99.6         324.9        55.7         56.3        18.3         455.2


                                                                                                           143
   139   140   141   142   143   144   145   146   147   148   149