
Page 145 - 7. State Of Environment Report Of Türkiye
P. 145
Industrial
processes
Year Change by Energy and product Agriculture Waste Total
1990 (%)
use
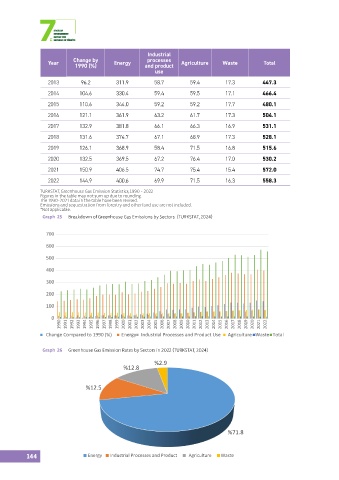
2013 96.2 311.9 58.7 59.4 17.3 447.3
2014 104.6 330.4 59.4 59.5 17.1 466.4
2015 110.6 344.0 59.2 59.2 17.7 480.1
2016 121.1 361.9 63.2 61.7 17.3 504.1
2017 132.9 381.8 66.1 66.3 16.9 531.1
2018 131.6 374.7 67.1 68.9 17.3 528.1
2019 126.1 368.9 58.4 71.5 16.8 515.6
2020 132.5 369.5 67.2 76.4 17.0 530.2
2021 150.9 406.5 74.7 75.4 15.4 572.0
2022 144.9 400.6 69.9 71.5 16.3 558.3
TURKSTAT, Greenhouse Gas Emission Statistics, 1990 - 2022
Figures in the table may not sum up due to rounding.
The 1990-2021 data in the table have been revised.
Emissions and sequestration from forestry and other land use are not included.
*Not applicable.
Graph 25 Breakdown of Greenhouse Gas Emissions by Sectors (TURKSTAT, 2024)
700
600
500
400
300
200
100
0
1990 1991 1992 1993 1994 1995 1996 1997 1998 1999 2000 2001 2002 2003 2004 2005 2006 2007 2008 2009 2010 2011 2012 2013 2014 2015 2016 2017 2018 2019 2020 2021 2022
Change Compared to 1990 (%) Energy Industrial Processes and Product Use Agriculture Waste Total
Graph 26 Greenhouse Gas Emission Rates by Sectors in 2022 (TURKSTAT, 2024)
%2.9
%12.8
%12.5
%71.8
144 Energy Industrial Processes and Product Agriculture Waste