
Page 146 - 7. State Of Environment Report Of Türkiye
P. 146
The energy sector ranks first in the amount of emissions by sectors. The largest share in total
greenhouse gas emissions in terms of CO equivalent in 2022 is energy-related emissions with
2
71.8%, followed by agriculture with 12.8%, industrial processes and product use with 12.5% and
waste sector with 2.9%.
Energy sector emissions are calculated as 400.6 Mt CO equivalent in 2022, increasing by 179.8%
2
compared to 1990, but decreasing by 1.4% compared to the previous year. Emissions from in-
dustrial processes and product use are calculated as 69.9 Mt CO equivalent, increasing by 208.1%
2
compared to 1990, but decreasing by 6.4% compared to the previous year.
Agriculture sector emissions in 2022 are calculated as 71.5 Mt CO equivalent, increasing by 37.9%
2
compared to 1990 but decreasing by 5.1% compared to the previous year, while waste sector
emissions are calculated as 16.3 Mt CO equivalent, increasing by 57.7% compared to 1990 and
2
5.5% compared to the previous year.
Data on greenhouse gas emissions (excluding LULUCF sector) are given above by using the
Greenhouse Gas Emission Statistics, published by TURKSTAT on 05 June 2024 (https://data.tuik.
gov.tr/Bulten/Index.p=Sera- Gazi-Emisyon-Istatistikleri-1990-2022-53701).
On the other hand, the results in the news bulletins published in 2023 and before are based on
the greenhouse gas inventory for the same period. The greenhouse gas inventory, which is re-
ported annually by 15 April under the UNFCCC, consists of National Inventory Report (NIR) and
Common Reporting Format (CRF) tables, and National greenhouse gas inventories are available
at (https://unfccc.int/ghg-inventories-annex- i-parties/2023).
1990-2022 National Greenhouse Gas Inventory Reports consist of National Inventory Document
(NID) and Common Reporting Tables (CRT) and can be accessed at (https://unfccc.int/ghg-in-
ventories-annex-i-parties/2024).
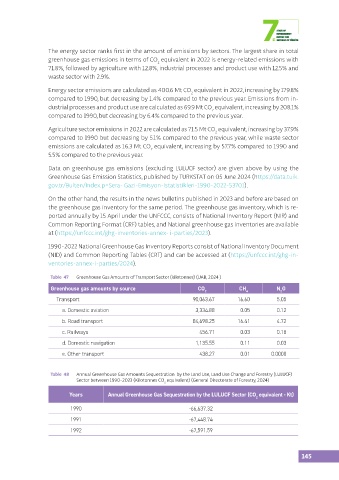
Table 47 Greenhouse Gas Amounts of Transport Sector (kilotonnes) (UAB, 2024 )
Greenhouse gas amounts by source CO CH N O
2 4 2
Transport 90,063.67 16.60 5.05
a. Domestic aviation 3,334.88 0.05 0.12
b. Road transport 84,698.25 16.41 4.72
c. Railways 456.71 0.03 0.18
d. Domestic navigation 1,135.55 0.11 0.03
e. Other transport 438.27 0.01 0.0008
Table 48 Annual Greenhouse Gas Amounts Sequestration by the Land Use, Land Use Change and Forestry (LULUCF)
Sector between 1990-2023 (Kilotonnes CO equivalent) (General Directorate of Forestry, 2024)
2
Years Annual Greenhouse Gas Sequestration by the LULUCF Sector (CO equivalent - Kt)
2
1990 -66,637.32
1991 -67,448.74
1992 -67,591.59
145