
Page 148 - 7. State Of Environment Report Of Türkiye
P. 148
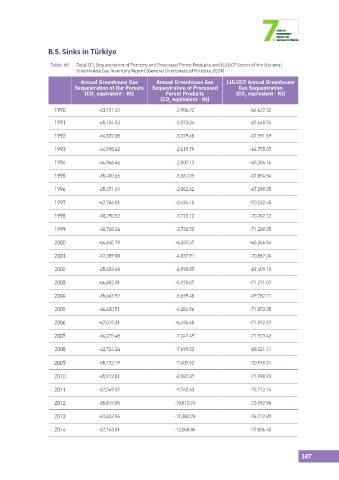
B.5. Sinks in Türkiye


                   Table  49  Total CO Sequestration of Forestry and Processed Forest Products and LULUCF Sector of the National
                                  2
                            Greenhouse Gas Inventory Report (General Directorate of Forestry, 2024)
                             Annual Greenhouse Gas      Annual Greenhouse Gas    LULUCF Annual Greenhouse
                           Sequestration of Our Forests   Sequestration of Processed   Gas Sequestration
                               (CO  equivalent - Kt)       Forest Products          (CO  equivalent - Kt)
                                  2                                                    2
                                                         (CO  equivalent - Kt)
                                                            2
                    1990            -63,731.32                 -2,906.72                 -66,637.32
                    1991            -65,154.53                 -2,573.34                 -67,448.74

                    1992            -64,837.08                 -3,379.68                 -67,591.59

                    1993            -64,998.42                 -2,619.79                 -66,755.07

                    1994            -66,966.46                 -2,507.13                 -68,386.16

                    1995            -65,400.66                 -3,361.05                 -67,854.54

                    1996            -65,471.69                 -2,882.62                 -67,290.05

                    1997            -67,786.81                 -3,494.10                 -70,532.45
                    1998            -68,290.52                 -3,773.12                 -70,702.72


                    1999            -68,748.34                 -3,730.50                 -71,280.05
                    2000            -64,640.79                 -4,337.47                 -68,346.54

                    2001            -67,389.00                 -4,037.91                 -70,887.24

                    2002            -65,633.68                 -4,998.85                 -69,409.10

                    2003            -66,882.01                 -5,178.07                 -71,271.07

                    2004            -65,663.97                 -5,699.48                 -69,782.71

                    2005            -66,630.51                 -6,284.96                 -71,853.05

                    2006            -67,015.31                 -6,496.68                 -71,592.57

                    2007            -66,275.48                 -7,247.49                 -71,973.42

                    2008            -62,724.34                 -7,699.03                 -68,321.41

                    2009            -65,132.19                 -7,407.52                 -70,978.31

                    2010            -65,912.81                 -8,587.37                 -71,998.93

                    2011            -67,549.37                 -9,742.43                 -75,712.14

                    2012            -65,815.85                -10,510.74                 -73,592.96
                    2013            -67,602.96                -11,080.78                 -76,712.89

                    2014            -67,143.81                -12,048.84                 -77,006.40


                                                                                                           147