Page 143 - 7. State Of Environment Report Of Türkiye
P. 143

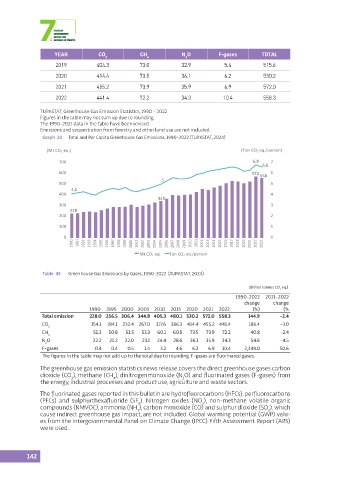
YEAR            CO 2          CH 4           N O          F-gases        TOTAL
                                                                  2
                     2019          404.3          73.0           32.9           5.4           515.6
                     2020          414.4          73.5           36.1           6.2           530.2
                     2021          455.2          73.9           35.9           6.9           572.0

                     2022          441.4          72.2           34.3          10.4           558.3

               TURKSTAT, Greenhouse Gas Emission Statistics, 1990 - 2022
               Figures in the table may not sum up due to rounding.
               The 1990-2021 data in the table have been revised.
               Emissions and sequestration from forestry and other land use are not included.
                Graph  23  Total and Per Capita Greenhouse Gas Emissions, 1990-2022 (TURKSTAT, 2024)

                  (Mt CO 2 eq.)                                                       (Ton CO 2 eq./person)

                      700                                                                 6,8   7
                                                                                             6,6
                      600                                                                 572  558  6
                                                          5
                      500                                                                       5
                          4,1
                      400                                                                       4
                                                        345
                      300                                                                       3
                          228
                      200                                                                       2

                      100                                                                       1
                       0                                                                        0
                          1990  1991  1992  1993  1994  1995  1996  1997  1998  1999  2000  2001  2002  2003  2004  2005  2006  2007  2008  2009  2010  2011  2012  2013  2014  2015  2016  2017  2018  2019  2020  2021  2022

                                                  Mt CO 2 eq.        Ton CO 2 eq./person


                Table  45  Greenhouse Gas Emissions by Gases, 1990-2022  (TURKSTAT, 2024)

                                                                                         (Billion tonnes CO  eq.)
                                                                                                   2
                                                                                    1990-2022  2021-2022
                                                                                       change    change
                                 1990  1995 2000 2005 2010   2015  2020  2021  2022       (%)        (%
                Total emission  228.0 256.5 306.4 344.8 405.3 480.1 530.2 572.0 558.3   144.9      -2.4
                CO               154.1  184.1 232.4 267.0  317.6 386.3 414.4 455.2 441.4  186.4    -3.0
                  2
                CH                51.3  50.8  51.5  53.3  60.1  60.5  73.5  73.9  72.2   40.8      -2.4
                  4
                N O               22.2  21.2  22.0  23.1  24.4  28.6  36.1  35.9  34.3   54.6      -4.5
                 2
                F-gases           0.4   0.4   0.5   1.4  3.2   4.6  6.2   6.9  10.4    2,349.0     50.6
                The figures in the table may not add up to the total due to rounding. F-gases are fluorinated gases.

               The greenhouse gas emission statistics news release covers the direct greenhouse gases carbon
               dioxide (CO ), methane (CH ), dinitrogenmonoxide (N O) and fluorinated gases (F-gases) from
                                                                 2
                          2
                                         4
               the energy, industrial processes and product use, agriculture and waste sectors.
               The fluorinated gases reported in this bulletin are hydrofluorocarbons (HFCs), perfluorocarbons
               (PFCs)  and sulphurthexafluoride  (SF ). Nitrogen oxides  (NO ), non-methane  volatile  organic
                                                                        x
                                                  6
               compounds (NMVOC), ammonia (NH ), carbon monoxide (CO) and sulphur dioxide (SO ), which
                                                 3
                                                                                               2
               cause indirect greenhouse gas impact, are not included. Global warming potential (GWP) valu-
               es from the Intergovernmental Panel on Climate Change (IPCC) Fifth Assessment Report (AR5)
               were used.


           142
   138   139   140   141   142   143   144   145   146   147   148