
Page 142 - 7. State Of Environment Report Of Türkiye
P. 142
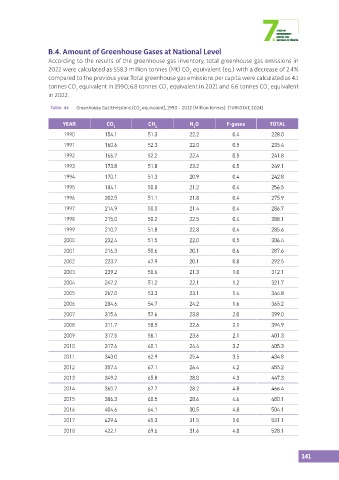
B.4. Amount of Greenhouse Gases at National Level
                  According to the results of the greenhouse gas inventory, total greenhouse gas emissions in
                  2022 were calculated as 558.3 million tonnes (Mt) CO  equivalent (eq.) with a decrease of 2.4%
                                                                    2
                  compared to the previous year. Total greenhouse gas emissions per capita were calculated as 4.1
                  tonnes CO  equivalent in 1990, 6.8 tonnes CO  equivalent in 2021 and 6.6 tonnes CO  equivalent
                            2                              2                                   2
                  in 2022.

                   Table  44  Greenhouse Gas Emissions (CO  equivalent), 1990 - 2022 (Million tonnes)  (TURKSTAT, 2024)
                                                  2
                       YEAR           CO 2           CH 4           N O          F-gases        TOTAL
                                                                     2
                       1990           154.1          51.3           22.2           0.4          228.0
                       1991           160.6          52.3           22.0           0.5          235.4
                       1992           166.7          52.2           22.4           0.5          241.8

                       1993           173.8          51.8           23.2           0.5          249.1
                       1994           170.1          51.3           20.9           0.4          242.8
                       1995           184.1          50.8           21.2           0.4          256.5

                       1996           202.5          51.1           21.8           0.4          275.9
                       1997           214.9          50.0           21.4           0.4          286.7
                       1998           215.0          50.2           22.5           0.4          288.1

                       1999           210.7          51.8           22.8           0.4          285.6
                       2000           232.4          51.5           22.0           0.5          306.4
                       2001           216.3          50.6           20.1           0.6          287.6
                       2002           223.7          47.9           20.1           0.8          292.5

                       2003           239.2          50.6           21.3           1.0          312.1
                       2004           247.2          51.2           22.1           1.2          321.7

                       2005           267.0          53.3           23.1           1.4          344.8
                       2006           284.6          54.7           24.2           1.6          365.2
                       2007           315.6          57.6           23.8           2.0          399.0
                       2008           311.7          58.5           22.6           2.1          394.9

                       2009           317.5          58.1           23.6           2.1          401.3
                       2010           317.6          60.1           24.4           3.2          405.3
                       2011           343.0          62.9           25.4           3.5          434.8

                       2012           357.4          67.1           26.4           4.2          455.2
                       2013           349.2          65.8           28.0           4.3          447.3
                       2014           365.7          67.7           28.2           4.8          466.4

                       2015           386.3          60.5           28.6           4.6          480.1
                       2016           404.6          64.1           30.5           4.8          504.1
                       2017           429.4          65.3           31.5           5.0          531.1

                       2018           422.1          69.6           31.6           4.8          528.1


                                                                                                           141