
Page 24 - Çevre Şehir ve İklim Dergisi İngilizce - Özel Sayı
P. 24
Breath: the Source of Life
“Air Quality Modelling Applications”
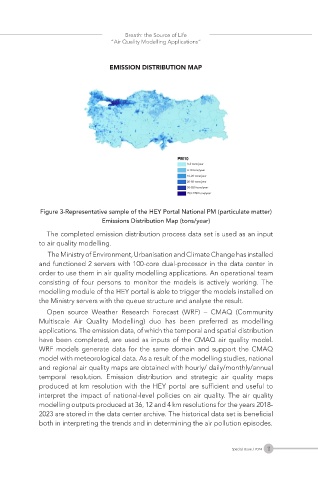
Figure 3-Representative sample of the HEY Portal National PM (particulate matter)
Emissions Distribution Map (tons/year)
The completed emission distribution process data set is used as an input
to air quality modelling.
The Ministry of Environment, Urbanisation and Climate Change has installed
and functioned 2 servers with 100-core dual-processor in the data center in
order to use them in air quality modelling applications. An operational team
consisting of four persons to monitor the models is actively working. The
modelling module of the HEY portal is able to trigger the models installed on
the Ministry servers with the queue structure and analyse the result.
Open source Weather Research Forecast (WRF) – CMAQ (Community
Multiscale Air Quality Modelling) duo has been preferred as modelling
applications. The emission data, of which the temporal and spatial distribution
have been completed, are used as inputs of the CMAQ air quality model.
WRF models generate data for the same domain and support the CMAQ
model with meteorological data. As a result of the modelling studies, national
and regional air quality maps are obtained with hourly/ daily/monthly/annual
temporal resolution. Emission distribution and strategic air quality maps
produced at km resolution with the HEY portal are sufficient and useful to
interpret the impact of national-level policies on air quality. The air quality
modelling outputs produced at 36, 12 and 4 km resolutions for the years 2018-
2023 are stored in the data center archive. The historical data set is beneficial
both in interpreting the trends and in determining the air pollution episodes.
11
Special Issue / 2024