
Page 27 - Çevre Şehir ve İklim Dergisi İngilizce - Özel Sayı
P. 27
İrde Çetintürk Gürtepe - Fatih Turan
Fatma Varank
the emissions due to stop-and-go, the intended use of the road, the impact of
the existing speed bumps/pedestrian crossings and the location of the road
have all been analysed. Different resolution, different structure and different
types of data were recorded in the raster database and parameters were
organized hierarchically in a multi-branched tree structure with an innovative
approach. NEFES software algorithm has been developed by weighting in
hierarchical parameter tree.
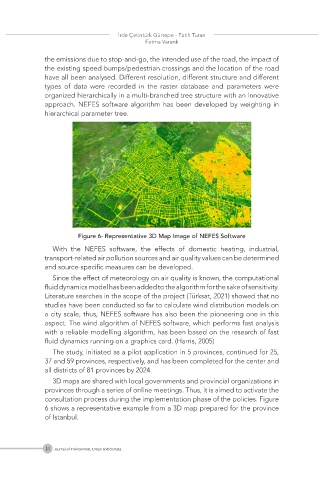
Figure 6- Representative 3D Map Image of NEFES Software
With the NEFES software, the effects of domestic heating, industrial,
transport-related air pollution sources and air quality values can be determined
and source-specific measures can be developed.
Since the effect of meteorology on air quality is known, the computational
fluid dynamics model has been added to the algorithm for the sake of sensitivity.
Literature searches in the scope of the project (Türksat, 2021) showed that no
studies have been conducted so far to calculate wind distribution models on
a city scale, thus, NEFES software has also been the pioneering one in this
aspect. The wind algorithm of NEFES software, which performs fast analysis
with a reliable modelling algorithm, has been based on the research of fast
fluid dynamics running on a graphics card. (Harris, 2005)
The study, initiated as a pilot application in 5 provinces, continued for 25,
37 and 59 provinces, respectively, and has been completed for the center and
all districts of 81 provinces by 2024.
3D maps are shared with local governments and provincial organizations in
provinces through a series of online meetings. Thus, it is aimed to activate the
consultation process during the implementation phase of the policies. Figure
6 shows a representative example from a 3D map prepared for the province
of Istanbul.
14 Journal of Environment, Urban and Climate