
Page 23 - Çevre Şehir ve İklim Dergisi İngilizce - Özel Sayı
P. 23
İrde Çetintürk Gürtepe - Fatih Turan
Fatma Varank
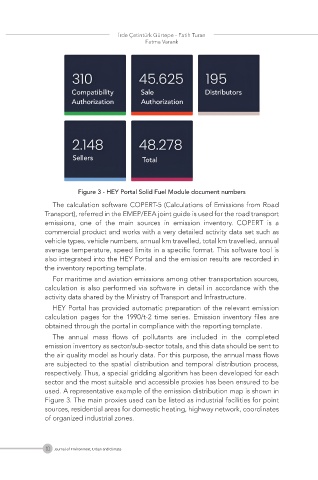
Figure 3 - HEY Portal Solid Fuel Module document numbers
The calculation software COPERT-5 (Calculations of Emissions from Road
Transport), referred in the EMEP/EEA joint guide is used for the road transport
emissions, one of the main sources in emission inventory. COPERT is a
commercial product and works with a very detailed activity data set such as
vehicle types, vehicle numbers, annual km travelled, total km travelled, annual
average temperature, speed limits in a specific format. This software tool is
also integrated into the HEY Portal and the emission results are recorded in
the inventory reporting template.
For maritime and aviation emissions among other transportation sources,
calculation is also performed via software in detail in accordance with the
activity data shared by the Ministry of Transport and Infrastructure.
HEY Portal has provided automatic preparation of the relevant emission
calculation pages for the 1990/t-2 time series. Emission inventory files are
obtained through the portal in compliance with the reporting template.
The annual mass flows of pollutants are included in the completed
emission inventory as sector/sub-sector totals, and this data should be sent to
the air quality model as hourly data. For this purpose, the annual mass flows
are subjected to the spatial distribution and temporal distribution process,
respectively. Thus, a special gridding algorithm has been developed for each
sector and the most suitable and accessible proxies has been ensured to be
used. A representative example of the emission distribution map is shown in
Figure 3. The main proxies used can be listed as industrial facilities for point
sources, residential areas for domestic heating, highway network, coordinates
of organized industrial zones.
10 Journal of Environment, Urban and Climate