
Page 25 - Çevre Şehir ve İklim Dergisi İngilizce - Özel Sayı
P. 25
İrde Çetintürk Gürtepe - Fatih Turan
Fatma Varank
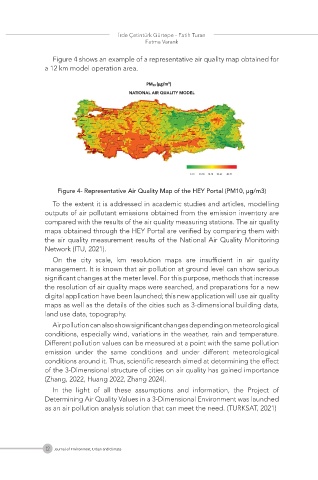
Figure 4 shows an example of a representative air quality map obtained for
a 12 km model operation area.
Figure 4- Representative Air Quality Map of the HEY Portal (PM10, µg/m3)
To the extent it is addressed in academic studies and articles, modelling
outputs of air pollutant emissions obtained from the emission inventory are
compared with the results of the air quality measuring stations. The air quality
maps obtained through the HEY Portal are verified by comparing them with
the air quality measurement results of the National Air Quality Monitoring
Network (ITU, 2021).
On the city scale, km resolution maps are insufficient in air quality
management. It is known that air pollution at ground level can show serious
significant changes at the meter level. For this purpose, methods that increase
the resolution of air quality maps were searched, and preparations for a new
digital application have been launched; this new application will use air quality
maps as well as the details of the cities such as 3-dimensional building data,
land use data, topography.
Air pollution can also show significant changes depending on meteorological
conditions, especially wind, variations in the weather, rain and temperature.
Different pollution values can be measured at a point with the same pollution
emission under the same conditions and under different meteorological
conditions around it. Thus, scientific research aimed at determining the effect
of the 3-Dimensional structure of cities on air quality has gained importance
(Zhang, 2022, Huang 2022, Zhang 2024).
In the light of all these assumptions and information, the Project of
Determining Air Quality Values in a 3-Dimensional Environment was launched
as an air pollution analysis solution that can meet the need. (TURKSAT, 2021)
12 Journal of Environment, Urban and Climate