
Page 179 - Çevre Şehir İklim İngilizce - Sayı 1
P. 179
Deniz Kaymak - Merih Aydınalp Köksal
In Table 3, The R2, corrected R2, showing the performance estimations of
the model, The Average Square root of the Errors (ASE) and Average Absolute
Error Percentage (AAEP) values are given. The R2 of the table is 0,995 and the
corrected R2 is 0,993. These values show that the estimation performance
of the model is quite high (Barnston, 1992). The modelling was made using
the currently available dependent data covering the years, 2005-2017. As
further data was not available, it wasn’t possible to make the calibration and
validation of the model.
Table 3: The Estimation Performance of the Model
Parameters Value
R2 0,995
Corrected R2 0,993
ASE 3.314.7
AAEP %6,29
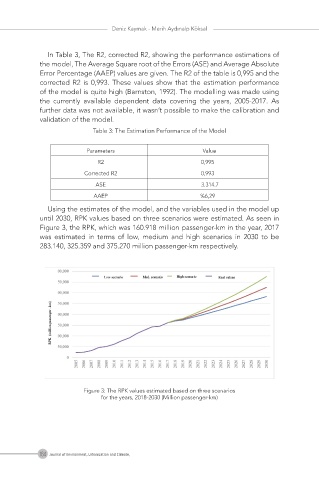
Using the estimates of the model, and the variables used in the model up
until 2030, RPK values based on three scenarios were estimated. As seen in
Figure 3, the RPK, which was 160.918 million passenger-km in the year, 2017
was estimated in terms of low, medium and high scenarios in 2030 to be
283.140, 325.359 and 375.270 million passenger-km respectively.
Figure 3: The RPK values estimated based on three scenarios
for the years, 2018-2030 (Million passenger-km)
164 Journal of Environment, Urbanization and Climate,