
Page 180 - Çevre Şehir İklim İngilizce - Sayı 1
P. 180
Estimation of Co Emission
2
When the results are compared with the estimations of the sector and
international institutions, it is seen that the results in this study are quite similar
to those of other studies (yearly around %4.4 to 4.7) (Airbus, 2018; Boeing,
2018; Embraer, 2018; ICAO, 2016). It is clear that the expected growth rate
concerning Europe are much lower than the growth of Turkish air passenger
traffic. In addition, when the enormous growth rate of aviation sector in
Türkiye between the years, 2005-2017 are taken into consideration, even in
the low scenario, Türkiye is expected to grow more than the World averages.
The results of the current study show that as the sector approaches saturation
stage, the growth trend in Türkiye is expected to slow down.
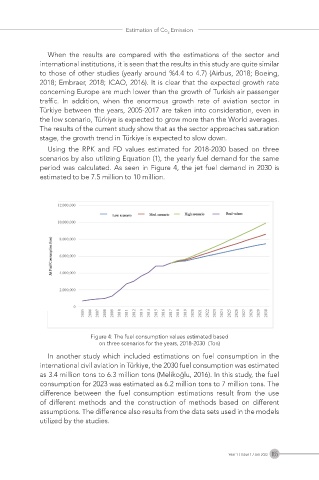
Using the RPK and FD values estimated for 2018-2030 based on three
scenarios by also utilizing Equation (1), the yearly fuel demand for the same
period was calculated. As seen in Figure 4, the jet fuel demand in 2030 is
estimated to be 7.5 million to 10 million.
Figure 4: The fuel consumption values estimated based
on three scenarios for the years, 2018-2030 (Ton)
In another study which included estimations on fuel consumption in the
international civil aviation in Türkiye, the 2030 fuel consumption was estimated
as 3.4 million tons to 6.3 million tons (Melikoğlu, 2016). In this study, the fuel
consumption for 2023 was estimated as 6.2 million tons to 7 million tons. The
difference between the fuel consumption estimations result from the use
of different methods and the construction of methods based on different
assumptions. The difference also results from the data sets used in the models
utilized by the studies.
Year 1 / Issue 1 / Jan 2022 165