
Page 150 - Çevre Şehir İklim İngilizce - Sayı 1
P. 150
The significance of pastures
decreased by 3.1% in 2019 compared to previous year, and was measured
as equivalent to 506,1 million-ton CO2. The total greenhouse gas emission
per person was 4-ton CO2 eq. in 1990, 6,4-ton CO2 eq. in 2018, and 6,1-ton
CO2 eq. in 2019. Agricultural sector emissions, on the other hand increased
by 47.7% compared to 1990, and by 4,1% compared to the previous year,
measured as 68 million-ton CO2 eq. (TÜİK, 2021a).
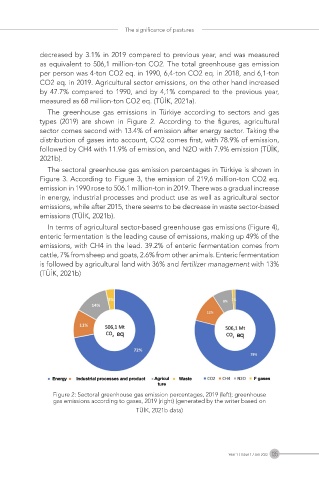
The greenhouse gas emissions in Türkiye according to sectors and gas
types (2019) are shown in Figure 2. According to the figures, agricultural
sector comes second with 13.4% of emission after energy sector. Taking the
distribution of gases into account, CO2 comes first, with 78.9% of emission,
followed by CH4 with 11.9% of emission, and N2O with 7.9% emission (TÜİK,
2021b).
The sectoral greenhouse gas emission percentages in Türkiye is shown in
Figure 3. According to Figure 3, the emission of 219,6 million-ton CO2 eq.
emission in 1990 rose to 506.1 million-ton in 2019. There was a gradual increase
in energy, industrial processes and product use as well as agricultural sector
emissions, while after 2015, there seems to be decrease in waste sector-based
emissions (TÜİK, 2021b).
In terms of agricultural sector-based greenhouse gas emissions (Figure 4),
enteric fermentation is the leading cause of emissions, making up 49% of the
emissions, with CH4 in the lead. 39.2% of enteric fermentation comes from
cattle, 7% from sheep and goats, 2.6% from other animals. Enteric fermentation
is followed by agricultural land with 36% and fertilizer management with 13%
(TÜİK, 2021b)
Figure 2: Sectoral greenhouse gas emission percentages, 2019 (left); greenhouse
gas emissions according to gases, 2019 (right) (generated by the writer based on
TÜİK, 2021b data)
Year 1 / Issue 1 / Jan 2022 135