
Page 68 - Çevre Şehir İklim İngilizce - Sayı 4
P. 68
Urban Transformation Forecasts with Artificial Intelligence
Based Algorithms
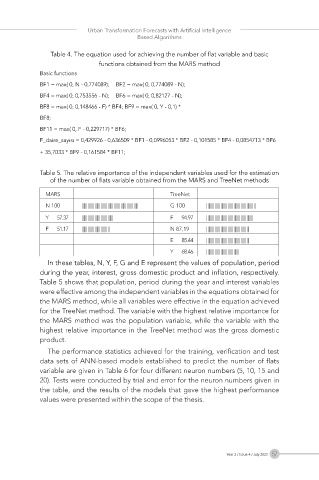
Table 4. The equation used for achieving the number of flat variable and basic
functions obtained from the MARS method
Basic functions
BF1 = max( 0, N - 0,774089); BF2 = max( 0, 0,774089 - N);
BF4 = max( 0, 0,753556 - N); BF6 = max( 0, 0,82127 - N);
BF8 = max( 0, 0,148466 - F) * BF4; BF9 = max( 0, Y - 0,1) *
BF8;
BF11 = max( 0, F - 0,229717) * BF6;
F_daire_sayısı = 0,429926 - 0,636509 * BF1 - 0,0996053 * BF2 - 0,101585 * BF4 - 0,0854713 * BF6
+ 35,7033 * BF9 - 0,161584 * BF11;
Table 5. The relative importance of the independent variables used for the estimation
of the number of flats variable obtained from the MARS and TreeNet methods
MARS TreeNet
N 100 |||||||||||||||||||||||||||||||||||||||||||||||| G 100 ||||||||||||||||||||||||||||||||||||||||||
Y 57.37 ||||||||||||||||||||||||||| F 94.97 ||||||||||||||||||||||||||||||||||||||||
F 51.17 |||||||||||||||||||||||| N 87,19 ||||||||||||||||||||||||||||||||||||
E 85.44 ||||||||||||||||||||||||||||||||||||
Y 68.46 ||||||||||||||||||||||||||||
In these tables, N, Y, F, G and E represent the values of population, period
during the year, interest, gross domestic product and inflation, respectively.
Table 5 shows that population, period during the year and interest variables
were effective among the independent variables in the equations obtained for
the MARS method, while all variables were effective in the equation achieved
for the TreeNet method. The variable with the highest relative importance for
the MARS method was the population variable, while the variable with the
highest relative importance in the TreeNet method was the gross domestic
product.
The performance statistics achieved for the training, verification and test
data sets of ANN-based models established to predict the number of flats
variable are given in Table 6 for four different neuron numbers (5, 10, 15 and
20). Tests were conducted by trial and error for the neuron numbers given in
the table, and the results of the models that gave the highest performance
values were presented within the scope of the thesis.
Year 2 / Issue 4 / July 2023 57