
Page 72 - Çevre Şehir İklim İngilizce - Sayı 4
P. 72
Urban Transformation Forecasts with Artificial Intelligence
Based Algorithms
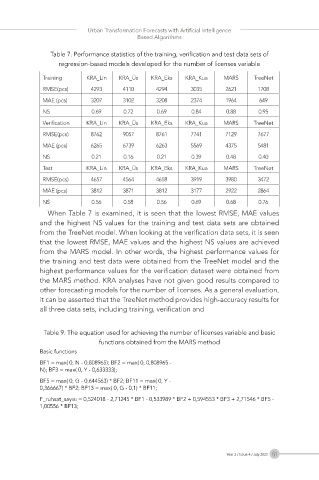
Table 7. Performance statistics of the training, verification and test data sets of
regression-based models developed for the number of licenses variable
Training KRA_Lin KRA_Üs KRA_Eks KRA_Kua MARS TreeNet
RMSE(pcs) 4293 4110 4294 3035 2621 1708
MAE (pcs) 3207 3102 3208 2374 1964 649
NS 0.69 0.72 0.69 0.84 0.88 0.95
Verification KRA_Lin KRA_Üs KRA_Eks KRA_Kua MARS TreeNet
RMSE(pcs) 8762 9057 8761 7741 7129 7677
MAE (pcs) 6265 6739 6263 5569 4375 5481
NS 0.21 0.16 0.21 0.39 0.48 0.40
Test KRA_Lin KRA_Üs KRA_Eks KRA_Kua MARS TreeNet
RMSE(pcs) 4657 4564 4658 3919 3980 3472
MAE (pcs) 3812 3871 3812 3177 2922 2864
NS 0.56 0.58 0.56 0.69 0.68 0.76
When Table 7 is examined, it is seen that the lowest RMSE, MAE values
and the highest NS values for the training and test data sets are obtained
from the TreeNet model. When looking at the verification data sets, it is seen
that the lowest RMSE, MAE values and the highest NS values are achieved
from the MARS model. In other words, the highest performance values for
the training and test data were obtained from the TreeNet model and the
highest performance values for the verification dataset were obtained from
the MARS method. KRA analyses have not given good results compared to
other forecasting models for the number of licenses. As a general evaluation,
it can be asserted that the TreeNet method provides high-accuracy results for
all three data sets, including training, verification and
Table 9. The equation used for achieving the number of licenses variable and basic
functions obtained from the MARS method
Basic functions
BF1 = max( 0, N - 0,808965); BF2 = max( 0, 0,808965 -
N); BF3 = max( 0, Y - 0,633333);
BF5 = max( 0, G - 0,644563) * BF2; BF11 = max( 0, Y -
0,366667) * BF2; BF13 = max( 0, G - 0,1) * BF11;
F_ruhsat_sayısı = 0,524018 - 2,71245 * BF1 - 0,533989 * BF2 + 0,594553 * BF3 + 2,71546 * BF5 -
1,00556 * BF13;
Year 2 / Issue 4 / July 2023 61