
Page 76 - Çevre Şehir İklim İngilizce - Sayı 4
P. 76
Urban Transformation Forecasts with Artificial Intelligence
Based Algorithms
When the prepared scatter graphs are examined, it is seen that the data
are closer to the diagonal in the TreeNet method. As can be understood from
these graphs, the model developed using the TreeNet method gave results
closer to the actual number of licenses compared to the model developed
using the ANN method.
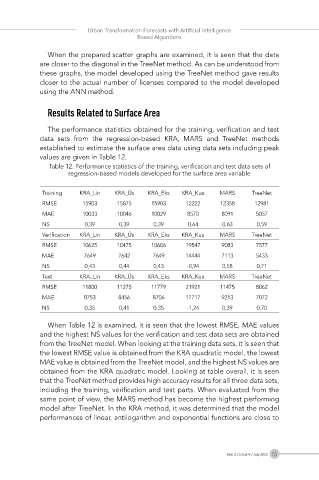
Results Related to Surface Area
The performance statistics obtained for the training, verification and test
data sets from the regression-based KRA, MARS and TreeNet methods
established to estimate the surface area data using data sets including peak
values are given in Table 12.
Table 12. Performance statistics of the training, verification and test data sets of
regression-based models developed for the surface area variable
Training KRA_Lin KRA_Üs KRA_Eks KRA_Kua MARS TreeNet
RMSE 15903 15875 15903 12222 12358 12981
MAE 10033 10046 10029 8570 8091 5057
NS 0,39 0,39 0,39 0,64 0,63 0,59
Verification KRA_Lin KRA_Üs KRA_Eks KRA_Kua MARS TreeNet
RMSE 10625 10475 10606 19547 9083 7577
MAE 7649 7642 7649 14444 7113 5433
NS 0,43 0,44 0,43 -0,94 0,58 0,71
Test KRA_Lin KRA_Üs KRA_Eks KRA_Kua MARS TreeNet
RMSE 11800 11275 11779 21921 11475 8062
MAE 8753 8456 8706 17717 9213 7072
NS 0,35 0,41 0,35 -1,24 0,39 0,70
When Table 12 is examined, it is seen that the lowest RMSE, MAE values
and the highest NS values for the verification and test data sets are obtained
from the TreeNet model. When looking at the training data sets, it is seen that
the lowest RMSE value is obtained from the KRA quadratic model, the lowest
MAE value is obtained from the TreeNet model, and the highest NS values are
obtained from the KRA quadratic model. Looking at table overall, it is seen
that the TreeNet method provides high accuracy results for all three data sets,
including the training, verification and test parts. When evaluated from the
same point of view, the MARS method has become the highest performing
model after TreeNet. In the KRA method, it was determined that the model
performances of linear, antilogarithm and exponential functions are close to
Year 2 / Issue 4 / July 2023 65