Page 309 - Çevre Şehir İklim İngilizce - Sayı 3
P. 309

Zeynep Özdemir - Merve Özkaynak


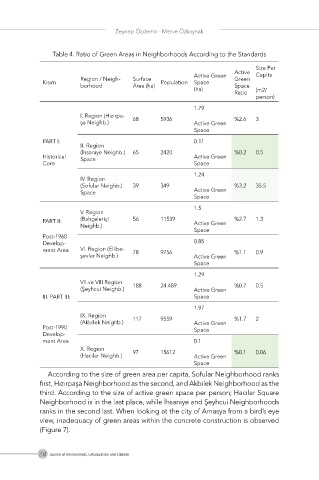
                Table 4. Ratio of Green Areas in Neighborhoods According to the Standards
                                                                          Size Per
                                                                    Active
                                                        Active Green      Capita
                        Region / Neigh-  Surface                    Green
             Kısım                             Population  Space
                        borhood        Area (ha)                    Space
                                                        (ha)              (m2/
                                                                    Ratio
                                                                          person)
                                                        1.79
                        I. Region (Hızırpa-  68  5936               %2.6  3
                        şa Neighb.)                     Active Green
                                                        Space
             PART I:                                    0.11
                        II. Region
                        (İhsaniye Neighb.)  65  2420                %0.2  0.5
             Historical   Space                         Active Green
             Core                                       Space
                                                        1.24
                        IV. Region
                        (Sofular Neighb.)  39  349                  %3.2  35.5
                        Space                           Active Green
                                                        Space
                                                        1.5
                        V. Region
             PART II:   (Bahçeleriçi   56      11539    Active Green   %2.7  1.3
                        Neighb.)
                                                        Space
             Post-1960
             Develop-                                   0.85
             ment Area  VI. Region (Ellibe-  78  9756               %1.1  0.9
                        şevler Neighb.)                 Active Green
                                                        Space
                                                        1.29
                        VII.ve VIII Region   188  24.489            %0.7  0.5
                        (Şeyhcui Neighb.)               Active Green
             III. PART III:                             Space
                                                        1.97
                        IX. Region     117     9559                 %1.7  2
                        (Akbilek Neighb.)               Active Green
             Post-1990                                  Space
             Develop-
             ment Area                                  0.1
                        X. Region      97      15612                %0.1  0.06
                        (Hacılar Neighb.)               Active Green
                                                        Space
               According to the size of green area per capita, Sofular Neighborhood ranks
            first, Hızırpaşa Neighborhood as the second, and Akbilek Neighborhood as the
            third. According to the size of active green space per person; Hacılar Square
            Neighborhood is in the last place, while İhsaniye and Şeyhcui Neighborhoods
            ranks in the second last. When looking at the city of Amasya from a bird’s eye
            view, inadequacy of green areas within the concrete construction is observed
            (Figure 7).


            294 Journal of Environment, Urbanization and Climate
   304   305   306   307   308   309   310   311   312   313   314