
Page 128 - Çevre Şehir İklim İngilizce - Sayı 1
P. 128
Urban Cold Space Cooling Capacity
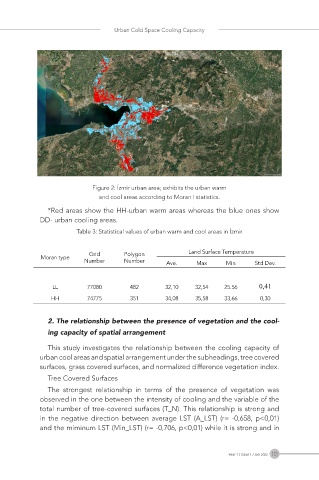
Figure 2: İzmir urban area; exhibits the urban warm
and cool areas according to Moran I statistics.
*Red areas show the HH-urban warm areas whereas the blue ones show
DD- urban cooling areas.
Table 3: Statistical values of urban warm and cool areas in İzmir
Grid Polygon Land Surface Temperature
Moran type
Number Number Ave. Max Min Std Dev.
LL 77080 482 32,10 32,54 25.56 0,41
HH 74775 351 34,08 35,58 33,66 0,30
2. The relationship between the presence of vegetation and the cool-
ing capacity of spatial arrangement
This study investigates the relationship between the cooling capacity of
urban cool areas and spatial arrangement under the subheadings, tree covered
surfaces, grass covered surfaces, and normalized difference vegetation index.
Tree Covered Surfaces
The strongest relationship in terms of the presence of vegetation was
observed in the one between the intensity of cooling and the variable of the
total number of tree-covered surfaces (T_N). This relationship is strong and
in the negative direction between average LST (A_LST) (r= -0,658, p<0,01)
and the miminum LST (Min_LST) (r= -0,706, p<0,01) while it is strong and in
Year 1 / Issue 1 / Jan 2022 113