
Page 125 - Çevre Şehir İklim İngilizce - Sayı 1
P. 125
Yasemin Şentürk - Kemal Mert Çubukçu
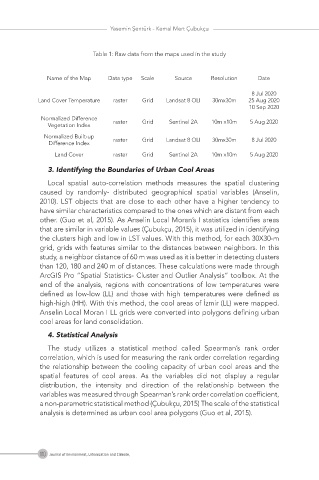
Table 1: Raw data from the maps used in the study
Name of the Map Data type Scale Source Resolution Date
8 Jul 2020
Land Cover Temperature raster Grid Landsat 8 OLI 30mx30m 25 Aug 2020
10 Sep 2020
Normalized Difference raster Grid Sentinel 2A 10m x10m 5 Aug 2020
Vegetation Index
Normalized Built-up raster Grid Landsat 8 OLI 30mx30m 8 Jul 2020
Difference Index
Land Cover raster Grid Sentinel 2A 10m x10m 5 Aug 2020
3. Identifying the Boundaries of Urban Cool Areas
Local spatial auto-correlation methods measures the spatial clustering
caused by randomly- distributed geographical spatial variables (Anselin,
2010). LST objects that are close to each other have a higher tendency to
have similar characteristics compared to the ones which are distant from each
other. (Guo et al, 2015). As Anselin Local Moran’s I statistics identifies areas
that are similar in variable values (Çubukçu, 2015), it was utilized in identifying
the clusters high and low in LST values. With this method, for each 30X30-m
grid, grids with features similar to the distances between neighbors. In this
study, a neighbor distance of 60 m was used as it is better in detecting clusters
than 120, 180 and 240 m of distances. These calculations were made through
ArcGIS Pro “Spatial Statistics- Cluster and Outlier Analysis” toolbox. At the
end of the analysis, regions with concentrations of low temperatures were
defined as low-low (LL) and those with high temperatures were defined as
high-high (HH). With this method, the cool areas of İzmir (LL) were mapped.
Anselin Local Moran I LL grids were converted into polygons defining urban
cool areas for land consolidation.
4. Statistical Analysis
The study utilizes a statistical method called Spearman’s rank order
correlation, which is used for measuring the rank order correlation regarding
the relationship between the cooling capacity of urban cool areas and the
spatial features of cool areas. As the variables did not display a regular
distribution, the intensity and direction of the relationship between the
variables was measured through Spearman’s rank order correlation coefficient,
a non-parametric statistical method (Çubukçu, 2015) The scale of the statistical
analysis is determined as urban cool area polygons (Guo et al, 2015).
110 Journal of Environment, Urbanization and Climate,