
Page 126 - Çevre Şehir İklim İngilizce - Sayı 1
P. 126
Urban Cold Space Cooling Capacity
The variables affecting the cooling capacity of urban cool areas in the study
were defined as average LST (A_LST), minimum LST (Min_LST), maximum LST
(Max_LST) and standard deviation LST (SD_LST). These variables are calculated
using the LST values of the grids within each urban cool area polygon. Since
the study adopts urban cool area polygons as a scale, average LST values
alone were deemed insufficient for identifying cooling capacity. Thus, other
explanatory statistical values were also utilized. Variables regarding spatial
features were classified into three categories, namely, (1) the presence (Ng et
al, 2012, Maimaitiyiming et al, 2014, Kuşçu Şimşek and Şengezer, 2012) and
spatial arrangement (Ren et al, 2013, Kong et al, 2014, Maimaitiyiming et al,
2014) of green areas, (2) the presence (Cheng et al, 2015, Du et al, 2016, Kong
et al, 2014) and spatial arrangement of land cover, and (3) the characteristics of
cooling capacity (Cao et al, 2010, Kong et al, 2014, Lin et al, 2015).
While the data set was being formed, data generated in various resolutions
through remote sensing was reduced to a patch scale for each variable. In other
words, the data was produced through the calculation of average, maximum,
minimum or standard deviation values for each urban cool area polygon.
For instance, A_LTS, NDVI, and NDBI values were calculated by calculating
the average of the NDVI and NDBI of grids within each urban cooling area.
Thus, values belonging to grids in various sizes are interpolated according to
the cooling area patches making up the study scale. The variables related to
tree, grass or water surfaces, on the other hand, are determined through the
calculation of the sum, average, maximum value and standard deviation of the
spatial size of each urban area polygon. To illustrate, the total forest surface
refers to the total square meters of the forest-covered surface areas within
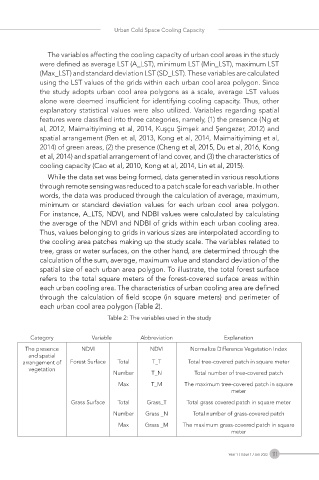
each urban cooling area. The characteristics of urban cooling area are defined
through the calculation of field scope (in square meters) and perimeter of
each urban cool area polygon (Table 2).
Table 2: The variables used in the study
Category Variable Abbreviation Explanation
The presence NDVI NDVI Normalize Difference Vegetation Index
and spatial
arrangement of Forest Surface Total T_T Total tree-covered patch in square meter
vegetation
Number T_N Total number of tree-covered patch
Max T_M The maximum tree-covered patch in square
meter
Grass Surface Total Grass_T Total grass covered patch in square meter
Number Grass _N Total number of grass-covered patch
Max Grass _M The maximum grass-covered patch in square
meter
Year 1 / Issue 1 / Jan 2022 111