
Page 127 - Çevre Şehir İklim İngilizce - Sayı 1
P. 127
Yasemin Şentürk - Kemal Mert Çubukçu
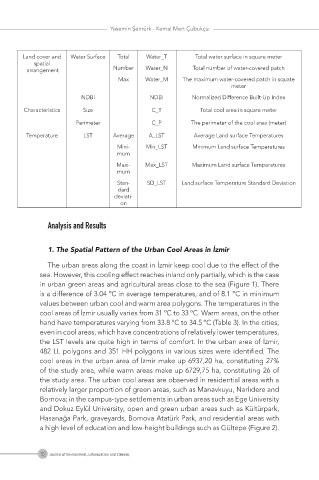
Land cover and Water Surface Total Water_T Total water surface in square meter
spatial
arrangement Number Water_N Total number of water-covered patch
Max Water_M The maximum water-covered patch in squate
meter
NDBI NDBI Normalized Difference Built-Up Index
Characteristics Size C_T Total cool area in square meter
Perimeter C_P The perimeter of the cool area (meter)
Temperature LST Average A_LST Average Land surface Temperatures
Mini- Min_LST Minimum Land surface Temperatures
mum
Maxi- Max_LST Maximum Land surface Temperatures
mum
Stan- SD_LST Land surface Temperature Standard Deviation
dard
deviati-
on
Analysis and Results
1. The Spatial Pattern of the Urban Cool Areas in İzmir
The urban areas along the coast in İzmir keep cool due to the effect of the
sea. However, this cooling effect reaches inland only partially, which is the case
in urban green areas and agricultural areas close to the sea (Figure 1). There
is a difference of 3.04 ºC in average temperatures, and of 8.1 ºC in minimum
values between urban cool and warm area polygons. The temperatures in the
cool areas of İzmir usually varies from 31 ºC to 33 ºC. Warm areas, on the other
hand have temperatures varying from 33.8 ºC to 34.5 ºC (Table 3). In the cities,
even in cool areas, which have concentrations of relatively lower temperatures,
the LST levels are quite high in terms of comfort. In the urban area of İzmir,
482 LL polygons and 351 HH polygons in various sizes were identified. The
cool areas in the urban area of İzmir make up 6937,20 ha, constituting 27%
of the study area, while warm areas make up 6729,75 ha, constituting 26 of
the study area. The urban cool areas are observed in residential areas with a
relatively larger proportion of green areas, such as Manavkuyu, Narlıdere and
Bornova; in the campus-type settlements in urban areas such as Ege University
and Dokuz Eylül University; open and green urban areas such as Kültürpark,
Hasanağa Park, graveyards, Bornova Atatürk Park, and residential areas with
a high level of education and low-height buildings such as Gültepe (Figure 2).
112 Journal of Environment, Urbanization and Climate,