
Page 57 - 7. State Of Environment Report Of Türkiye
P. 57
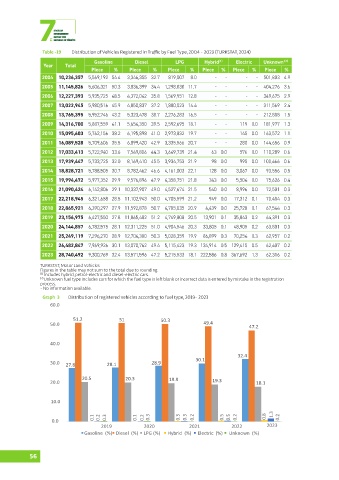
Table -19  Distribution of Vehicles Registered in Traffic by Fuel Type, 2004 - 2023 (TURKSTAT, 2024)
                                  Gasoline      Diesel         LPG       Hybrid (1)  Electric  Unknown  (2)
                Year    Total
                                 Piece   %    Piece    %    Piece   %   Piece   %  Piece   %  Piece   %
                2004  10,236,357  5,569,192 54.4  3,346,355 32.7  819,007  8.0  -  -   -   -  501,803 4.9
                2005  11,145,826  5,606,321 50.3  3,836,399 34.4 1,298,830 11.7  -  -  -   -  404,276 3.6
                2006  12,227,393  5,935,725 48.5  4,372,042 35.8 1,569,951 12.8  -  -  -   -  349,675 2.9
                2007  13,022,945  5,980,516 45.9  4,850,837 37.2 1,880,023 14.4  -  -  -   -  311,569 2.4
                2008  13,765,395  5,952,746 43.2  5,323,478 38.7 2,276,283 16.5  -  -  -   -  212,888 1.5
                2009  14,316,700  5,887,559 41.1  5,654,350 39.5 2,592,695 18.1  -  -  119 0.0  181,977 1.3
                2010  15,095,603  5,762,156 38.2  6,195,898 41.0 2,973,832 19.7  -  -  145 0.0  163,572 1.1
                2011  16,089,528  5,709,606 35.5  6,899,420 42.9 3,335,566 20.7  -  -  280 0.0  144,656 0.9

                2012  17,033,413  5,722,940 33.6  7,549,806 44.3 3,649,739 21.4  63 0.0  576 0.0  110,289 0.6
                2013  17,939,447  5,733,725 32.0  8,169,410 45.5 3,934,753 21.9  98 0.0  995 0.0  100,466 0.6
                2014  18,828,721  5,788,505 30.7  8,782,462 46.6 4,161,003 22.1  128 0.0  3,067 0.0  93,556 0.5
                2015  19,994,472  5,977,352 29.9  9,576,896 47.9 4,358,751 21.8  343 0.0  5,504 0.0  75,626 0.4
                2016  21,090,424  6,142,806 29.1 10,337,907 49.0 4,527,674 21.5  540 0.0  8,996 0.0  72,501 0.3
                2017  22,218,945  6,321,658 28.5 11,102,943 50.0 4,705,599 21.2  949 0.0  17,312 0.1  70,484 0.3
                2018  22,865,921  6,390,297 27.9 11,592,878 50.7 4,785,035 20.9  4,439 0.0  25,728 0.1  67,544 0.3
                2019  23,156,975  6,427,550 27.8 11,865,482 51.2 4,749,808 20.5  13,901 0.1  35,843 0.2  64,391 0.3
                2020  24,144,857  6,782,575 28.1 12,311,225 51.0 4,904,546 20.3  33,805 0.1  48,905 0.2  63,801 0.3
                2021  25,249,119  7,296,270 28.9 12,704,380 50.3 5,028,359 19.9  86,899 0.3  70,254 0.3  62,957 0.2
                2022  26,482,847  7,969,926 30.1 13,070,762 49.4 5,115,423 19.3 134,914 0.5 129,415 0.5  62,407 0.2
                2023  28,740,492  9,300,769 32.4 13,571,596 47.2 5,215,533 18.1 222,586 0.8 367,692 1.3  62,316 0.2

               TURKSTAT, Motor Land Vehicles
               Figures in the table may not sum to the total due to rounding.
               (1)  Includes hybrid, petrol-electric and diesel-electric cars.
               (2)  Unknown fuel type includes cars for which the fuel type is left blank or incorrect data is entered by mistake in the registration
               process.
               - No information available.
                Graph  3  Distribution of registered vehicles according to fuel type, 2019- 2023
                   60.0

                           51.2            51            50.3
                   50.0                                                  49.4
                                                                                         47.2

                   40.0

                                                                                    32.4
                                                                      30.1
                   30.0  27.8          28.1           28.9

                              20.5           20.3           19.9
                   20.0                                                     19.3           18.1


                   10.0


                   0.0            0.1  0.2  0.3  0.1  0.2  0.3  0.3  0.3  0.2  0.5  0.5  0.2  0.8  1.3  0.2
                                     2019           2020           2021           2022         2023
                               Gasoline  (%)   Diesel  (%)  LPG (%)   Hybrid  (%)  Electric  (%)   Unknown  (%)


           56