Page 191 - 7. State Of Environment Report Of Türkiye
P. 191

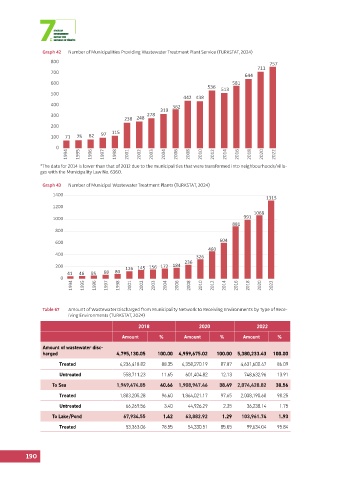
Graph 42  Number of Municipalities Providing Wastewater Treatment Plant Service (TURKSTAT, 2024)
                   800                                                                          757
                                                                                           711
                   700
                                                                                       644
                   600                                                             581
                                                                          536  513
                   500
                                                                 442 438
                   400                                        362
                                                         319
                   300                               278
                                             238 248
                   200
                   100  71  75  82   97  115

                     0
                         1994  1995  1996  1997  1998  2001  2002  2003  2004  2006  2008  2010  2012  2014  2016  2018  2020  2022

               *The data for 2014 is lower than that of 2012 due to the municipalities that were transformed into neighbourhoods/villa-
               ges with the Municipality Law No. 6360.

                Graph 43  Number of Municipal Wastewater Treatment Plants (TURKSTAT, 2024)
                    1400
                                                                                               1315
                    1200
                                                                                          1068
                    1000                                                               991
                                                                                   881
                    800
                    600                                                       604
                                                                          460
                    400                                               326
                                                                  236
                    200                      126 145 156 172 184
                         41  46  55  68  80
                      0
                          1994  1995  1996  1997  1998  2001  2002  2003  2004  2006  2008  2010  2012  2014  2016  2018  2020  2022


                Table 67  Amount of Wastewater Discharged from Municipality Network to Receiving Environments by Type of Rece-
                         iving Environments (TURKSTAT, 2024)

                                                  2018                 2020                2022
                                            Amount       %        Amount      %       Amount       %
                Amount of wastewater disc-
                harged                    4,795,130.05  100.00  4,959,675.02  100.00  5,380,233.43  100.00
                      Treated              4,236,418.82   88.35  4,358,270.19  87.87  4,631,600.47  86.09
                      Untreated             558,711.23    11.65   601,404.82   12.13   748,632.96  13.91

                   To Sea                 1,949,474.85   40.66  1,908,947.46  38.49  2,074,428.82  38.56
                      Treated              1,883,205.28   96.60  1,864,021.17  97.65  2,038,190.68  98.25
                      Untreated              66,269.56     3.40    44,926.29   2.35     36,238.14  1.75
                   To Lake/Pond             67,934.55     1.42    63,882.92    1.29   103,961.74   1.93

                      Treated                53,363.06    78.55    54,330.51   85.05    99,634.04  95.84


          190
   186   187   188   189   190   191   192   193   194   195   196