Page 187 - 7. State Of Environment Report Of Türkiye
P. 187

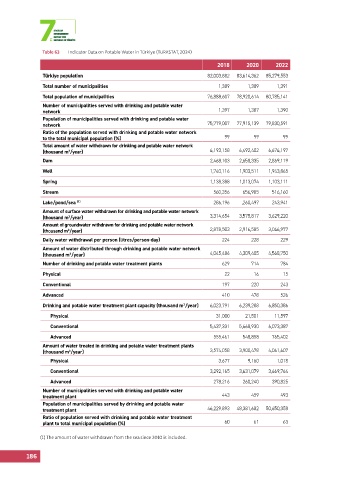
Table 63  Indicator Data on Potable Water in Türkiye (TURKSTAT, 2024)

                                                                             2018       2020      2022
                Türkiye population                                        82,003,882  83,614,362  85,279,553
                Total number of municipalities                                1,389     1,389     1,391
                Total population of municipalities                        76,888,607  78,920,614  80,785,141
                Number of municipalities served with drinking and potable water
                network                                                       1,397     1,387     1,390
                Population of municipalities served with drinking and potable water
                network                                                   75,779,007  77,915,139  79,830,591
                Ratio of the population served with drinking and potable water network
                to the total municipal population (%)                           99        99        99
                Total amount of water withdrawn for drinking and potable water network
                (thousand m /year)                                         6,193,158  6,492,402  6,676,197
                         3
                Dam                                                        2,468,103  2,658,335  2,869,119

                Well                                                       1,740,116  1,903,511  1,943,865
                Spring                                                     1,138,388  1,013,074  1,103,111
                Stream                                                      560,356   656,985    516,160

                Lake/pond/sea  (1)                                          286,196   ,260,497   243,941
                Amount of surface water withdrawn for drinking and potable water network
                (thousand m /year)                                         3,314,654  3,575,817  3,629,220
                         3
                Amount of groundwater withdrawn for drinking and potable water network
                (thousand m /year)                                         2,878,503  2,916,585  3,046,977
                         3
                Daily water withdrawal per person (litres/person-day)          224       228        229
                Amount of water distributed through drinking and potable water network
                         3
                (thousand m /year)                                         4,045,486  4,309,405  4,568,750
                Number of drinking and potable water treatment plants          629       714        784
                Physical                                                        22        16        15

                Conventional                                                   197       220        243
                Advanced                                                       410       478        526
                                                                 3
                Drinking and potable water treatment plant capacity (thousand m /year)  6,023,791  6,239,288  6,850,386
                      Physical                                               31,000    21,501    11,597

                      Conventional                                         5,437,331  5,668,930  6,073,387
                      Advanced                                              555,461   548,858    765,402
                Amount of water treated in drinking and potable water treatment plants
                (thousand m /year)                                         3,574,058  3,900,478  4,061,607
                         3
                      Physical                                                3,677     9,160     1,018

                      Conventional                                         3,292,165  3,631,079  3,669,764
                      Advanced                                              278,216   260,240    390,825
                Number of municipalities served with drinking and potable water
                treatment plant                                                443       459        493
                Population of municipalities served by drinking and potable water
                treatment plant                                           46,229,893  48,381,682  50,650,358
                Ratio of population served with drinking and potable water treatment
                plant to total municipal population (%)                         60        61        63

               (1) The amount of water withdrawn from the sea since 2010 is included.


          186
   182   183   184   185   186   187   188   189   190   191   192