Page 190 - 7. State Of Environment Report Of Türkiye
P. 190

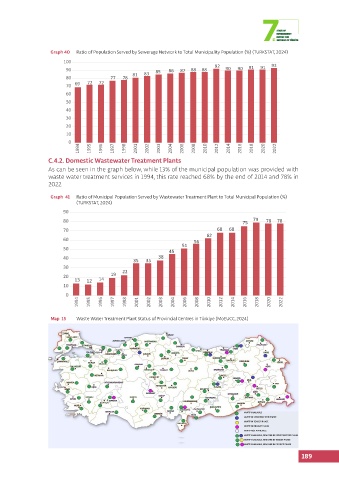
Graph 40  Ratio of Population Served by Sewerage Network to Total Municipality Population (%) (TURKSTAT, 2024)
                       100                                                                      93
                        90                          83  85  86  87  88  88  92  90  90  91  91
                        80              77  78  81
                        70  69  72  72
                        60
                        50
                        40
                        30
                        20
                        10
                         0
                             1994  1995  1996  1997  1998  2001  2002  2003  2004  2006  2008  2010  2012  2014  2016  2018  2020  2022
                  C.4.2. Domestic Wastewater Treatment Plants
                  As can be seen in the graph below, while 13% of the municipal population was provided with
                  waste water treatment services in 1994, this rate reached 68% by the end of 2014 and 78% in
                  2022.
                   Graph  41  Ratio of Municipal Population Served by Wastewater Treatment Plant to Total Municipal Population (%)
                            (TURKSTAT, 2024)
                       90
                       80                                                             75  79  78  78
                       70                                                    68  68
                                                                          62
                       60                                            56
                                                                 51
                       50                                   45
                       40                                38
                                                35  35
                       30                   22
                       20               19
                           13  12   14
                       10
                        0
                            1994  1995  1996  1997  1998  2001  2002  2003  2004  2006  2008  2010  2012  2014  2016  2018  2020  2022


                   Map  15  Waste Water Treatment Plant Status of Provincial Centres in Türkiye (MoEUCC, 2024)


                                                                                       WWTP AVAILABLE
                                                                                       WWTP IN CONSTRUCTION PHASE
                                                                                       WWTP IN TENDER PHASE
                                                                                       WWTP IN PROJECT PHASE
                                                                                       WWTP NOT AVAILABLE
                                                                                       WWTP AVAILABLE, NEW ONE IN CONSTRUCTION PHASE
                                                                                       WWTP AVAILABLE, NEW ONE IN TENDER PHASE
                                                                                       WWTP AVAILABLE, NEW ONE IN PROJECT PHASE
                                                                                                           189
   185   186   187   188   189   190   191   192   193   194   195