Page 153 - Çevre Şehir ve İklim Dergisi İngilizce - Özel Sayı
P. 153

İskender Demirtaş - Günay Erpu


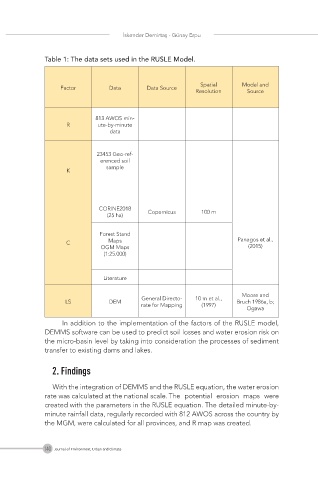
              Table 1: The data sets used in the RUSLE Model.


                                                           Spatial     Model and
                   Factor        Data       Data Source
                                                          Resolution     Source


                             813 AWOS min-
                    R        ute-by-minute
                                 data


                             23453 Geo-ref-
                              erenced soil
                                sample
                    K


                              CORINE2018    Copernicus      100 m
                                (25 ha)


                              Forest Stand
                    C            Maps                                 Panagos et al.,
                              OGM Maps                                   (2015)
                               (1:25.000)


                               Literature

                                                                       Moore and
                                          General Directo-  10 m et al.,
                    LS           DEM                                  Bruch 1986a, b;
                                          rate for Mapping  (1997)
                                                                         Ogawa
                    In addition to the implementation of the factors of the RUSLE model,
              DEMMS software can be used to predict soil losses and water erosion risk on
              the micro-basin level by taking into consideration the processes of sediment
              transfer to existing dams and lakes.

                2. Findings


                With the integration of DEMMS and the RUSLE equation, the water erosion
              rate was calculated at the national scale. The  potential  erosion  maps  were
              created with the parameters in the RUSLE equation. The detailed minute-by-
              minute rainfall data, regularly recorded with 812 AWOS across the country by
              the MGM, were calculated for all provinces, and R map was created.


              140 Journal of Environment, Urban and Climate
   148   149   150   151   152   153   154   155   156   157   158