
Page 151 - Çevre Şehir ve İklim Dergisi İngilizce - Özel Sayı
P. 151
İskender Demirtaş - Günay Erpu
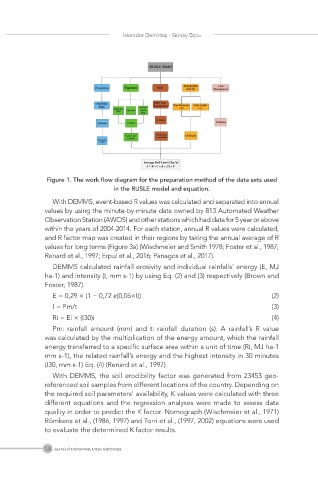
Figure 1. The work flow diagram for the preparation method of the data sets used
in the RUSLE model and equation.
With DEMMS, event-based R values was calculated and separated into annual
values by using the minute-by-minute data owned by 813 Automated Weather
Observation Station (AWOS) and other stations which had data for 5 year or above
within the years of 2004-2014. For each station, annual R values were calculated,
and R factor map was created in their regions by taking the annual average of R
values for long terms (Figure 3a) (Wischmeier and Smith 1978; Foster et al., 1987;
Renard et al., 1997; Erpul et al., 2016; Panagos et al., 2017).
DEMMS calculated rainfall erosivity and individual rainfalls’ energy (E, MJ
ha-1) and intensity (I, mm s-1) by using Eq. (2) and (3) respectively (Brown and
Foster, 1987).
E = 0,29 × (1 − 0,72 (0,05×I)) (2)
I = Pm/t (3)
Ri = Ei × (I30)i (4)
Pm: rainfall amount (mm) and t: rainfall duration (s). A rainfall’s R value
was calculated by the multiplication of the energy amount, which the rainfall
energy transferred to a specific surface area within a unit of time (Ri, MJ ha-1
mm s-1), the related rainfall’s energy and the highest intensity in 30 minutes
(I30, mm s-1) Eq. (4) (Renard et al., 1997).
With DEMMS, the soil erodibility factor was generated from 23453 geo-
referenced soil samples from different locations of the country. Depending on
the required soil parameters’ availability, K values were calculated with three
different equations and the regression analyses were made to assess data
quality in order to predict the K factor. Nomograph (Wischmeier et al., 1971)
Römkens et al., (1986, 1997) and Torri et al., (1997, 2002) equations were used
to evaluate the determined K factor results.
138 Journal of Environment, Urban and Climate