
Page 149 - Çevre Şehir İklim İngilizce - Sayı 2
P. 149
Elçin Sarı - Sevim Pelin Öztürk - İmdat As
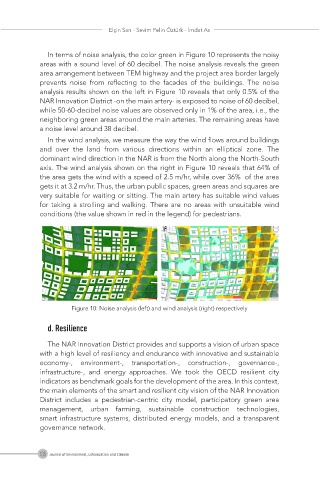
In terms of noise analysis, the color green in Figure 10 represents the noisy
areas with a sound level of 60 decibel. The noise analysis reveals the green
area arrangement between TEM highway and the project area border largely
prevents noise from reflecting to the facades of the buildings. The noise
analysis results shown on the left in Figure 10 reveals that only 0.5% of the
NAR Innovation District -on the main artery- is exposed to noise of 60 decibel,
while 50-60-decibel noise values are observed only in 1% of the area, i.e., the
neighboring green areas around the main arteries. The remaining areas have
a noise level around 38 decibel.
In the wind analysis, we measure the way the wind flows around buildings
and over the land from various directions within an elliptical zone. The
dominant wind direction in the NAR is from the North along the North-South
axis. The wind analysis shown on the right in Figure 10 reveals that 64% of
the area gets the wind with a speed of 2.5 m/hr, while over 36% of the area
gets it at 3.2 m/hr. Thus, the urban public spaces, green areas and squares are
very suitable for waiting or sitting. The main artery has suitable wind values
for taking a strolling and walking. There are no areas with unsuitable wind
conditions (the value shown in red in the legend) for pedestrians.
Figure 10: Noise analysis (left) and wind analysis (right) respectively
d. Resilience
The NAR Innovation District provides and supports a vision of urban space
with a high level of resiliency and endurance with innovative and sustainable
economy-, environment-, transportation-, construction-, governance-,
infrastructure-, and energy approaches. We took the OECD resilient city
indicators as benchmark goals for the development of the area. In this context,
the main elements of the smart and resilient city vision of the NAR Innovation
District includes a pedestrian-centric city model, participatory green area
management, urban farming, sustainable construction technologies,
smart infrastructure systems, distributed energy models, and a transparent
governance network.
135 Journal of Environment, Urbanization and Climate