
Page 79 - Çevre Şehir İklim İngilizce - Sayı 1
P. 79
Ayşe Sever Akdağ - Gülen Güllü
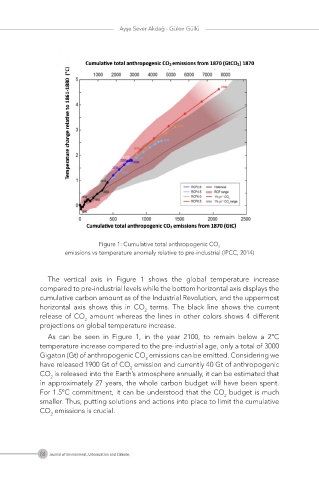
Figure 1: Cumulative total anthropogenic CO
2
emissions vs temperature anomaly relative to pre-industrial (IPCC, 2014)
The vertical axis in Figure 1 shows the global temperature increase
compared to pre-industrial levels while the bottom horizontal axis displays the
cumulative carbon amount as of the Industrial Revolution, and the uppermost
horizontal axis shows this in CO terms. The black line shows the current
2
release of CO amount whereas the lines in other colors shows 4 different
2
projections on global temperature increase.
As can be seen in Figure 1, in the year 2100, to remain below a 2°C
temperature increase compared to the pre-industrial age, only a total of 3000
Gigaton (Gt) of anthropogenic CO emissions can be emitted. Considering we
2
have released 1900 Gt of CO emission and currently 40 Gt of anthropogenic
2
CO is released into the Earth’s atmosphere annually, it can be estimated that
2
in approximately 27 years, the whole carbon budget will have been spent.
For 1.5°C commitment, it can be understood that the CO budget is much
2
smaller. Thus, putting solutions and actions into place to limit the cumulative
CO emissions is crucial.
2
64 Journal of Environment, Urbanization and Climate,