
Page 230 - 7. State Of Environment Report Of Türkiye
P. 230
D.12. Non-Hazardous Waste
D.12.1. Iron and Steel Industry and Slag Waste
In the “Waste Statistics, 2022” Newsletter published on the website of TURKSTAT Corporate (tuik.
gov.tr), the amount of waste generated by the manufacturing industry sub-sectors is presented
in the table “Table-1 Manufacturing industry sub-sectors waste statistics”.
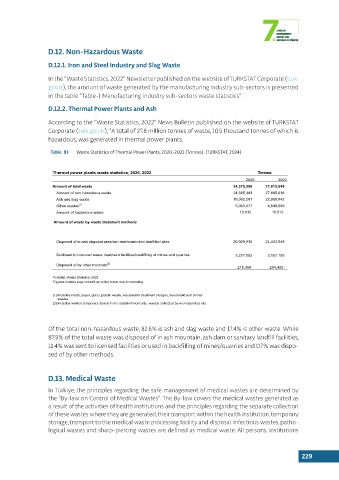
D.12.2. Thermal Power Plants and Ash
According to the “Waste Statistics, 2022” News Bulletin published on the website of TURKSTAT
Corporate (tuik.gov.tr), “A total of 27.8 million tonnes of waste, 10.5 thousand tonnes of which is
hazardous, was generated in thermal power plants.
Table 83 Waste Statistics of Thermal Power Plants, 2020-2022 (Tonnes) (TURKSTAT, 2024)
Termik santraller atık istatistikleri, 2020, 2022
Thermal power plants waste statistics, 2020, 2022 Tonnes
2020 2022
Amount of total waste 24,375,356 27,815,548
Amount of non-hazardous waste 24,365,343 27,805,036
Ash and slag waste 19,362,267 22,956,942
Other wastes (1) 5,003,077 4,848,093
Amount of hazardous waste 10,012 10,512
Amount of waste by waste treatment methods
Disposed of in ash disposal area/ash dam/controlled landfilled sites 20,929,936 24,453,948
Sold/sent to licenced waste treatment facilities/backfilling of mines and quarries 3,227,052 3,157,193
Disposed of by other methods (2)
218,368 204,406
TurkStat, Waste Statistics, 2022
Figures in table may not add up to the totals due to rounding.
(1) Includes metal, paper, glass, plastic waste, wastewater treatment sludges, household and similar
wastes.
(2) Includes wastes temporary stored in the establishment site, wastes collected by municipalities etc.
Of the total non-hazardous waste, 82.6% is ash and slag waste and 17.4% is other waste. While
87.9% of the total waste was disposed of in ash mountain, ash dam or sanitary landfill facilities,
11.4% was sent to licensed facilities or used in backfilling of mines/quarries and 0.7% was dispo-
sed of by other methods.
D.13. Medical Waste
In Türkiye, the principles regarding the safe management of medical wastes are determined by
the “By-law on Control of Medical Wastes”. The By-law covers the medical wastes generated as
a result of the activities of health institutions and the principles regarding the separate collection
of these wastes where they are generated, their transport within the health institution, temporary
storage, transport to the medical waste processing facility and disposal. Infectious wastes, patho-
logical wastes and sharp-piercing wastes are defined as medical waste. All persons, institutions
229