
Page 216 - 7. State Of Environment Report Of Türkiye
P. 216
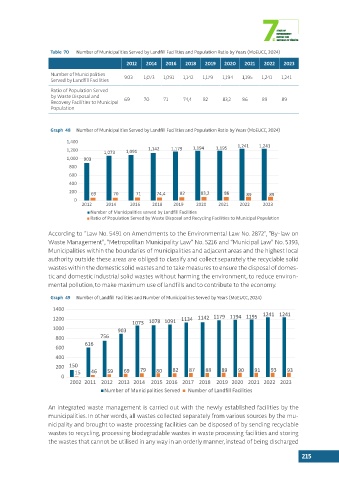
Table  70  Number of Municipalities Served by Landfill Facilities and Population Ratio by Years (MoEUCC, 2024)
                                             2012   2014   2016   2018   2019   2020   2021   2022   2023

                   Number of Municipalities   903   1,073  1,091  1,142  1,179  1,194  1,195  1,241  1,241
                   Served by Landfill Facilities
                   Ratio of Population Served
                   by Waste Disposal and
                   Recovery Facilities to Municipal   69  70  71  74,4  82     83,2   86     89     89
                   Population


                   Graph  48  Number of Municipalities Served by Landfill Facilities and Population Ratio by Years (MoEUCC, 2024)
                        1,400
                        1,200        1,073   1,091   1,142   1,179   1,194   1,195  1,241   1,241
                        1,000  903
                         800
                         600
                         400
                         200     69      70      71     74,4    82      83,2    86      89      89
                           0
                              2012    2014     2016    2018   2019    2020    2021   2022    2023
                                 Number of Municipalities served by Landfill Facilities
                                 Ratio of Population Served by Waste Disposal and Recycling Facilities to Municipal Population

                  According to “Law No. 5491 on Amendments to the Environmental Law No. 2872”, “By-law on
                  Waste Management”, “Metropolitan Municipality Law” No. 5216 and “Municipal Law” No. 5393,
                  Municipalities within the boundaries of municipalities and adjacent areas and the highest local
                  authority outside these areas are obliged to classify and collect separately the recyclable solid
                  wastes within the domestic solid wastes and to take measures to ensure the disposal of domes-
                  tic and domestic industrial solid wastes without harming the environment, to reduce environ-
                  mental pollution, to make maximum use of landfills and to contribute to the economy.
                   Graph  49  Number of Landfill Facilities and Number of Municipalities Served by Years (MoEUCC, 2024)

                    1400
                    1200                                         1134  1142 1179 1194 1195   1241 1241
                                               1073  1078 1091
                    1000                  903
                     800            756
                     600       616
                     400

                     200  150
                           15    46    59    69   79    80    82   87    88    89    90   91    93    93
                       0
                          2002  2011  2012  2013  2014  2015  2016 2017  2018  2019  2020 2021  2022 2023
                                      Number of Municipalities Served      Number of Landfill Facilities

                  An integrated waste management is carried out with the newly established facilities by the
                  municipalities. In other words, all wastes collected separately from various sources by the mu-
                  nicipality and brought to waste processing facilities can be disposed of by sending recyclable
                  wastes to recycling, processing biodegradable wastes in waste processing facilities and storing
                  the wastes that cannot be utilised in any way in an orderly manner, instead of being discharged

                                                                                                           215