
Page 221 - 7. State Of Environment Report Of Türkiye
P. 221
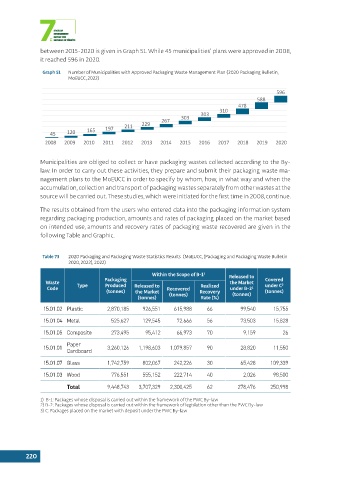
between 2015-2020 is given in Graph 51. While 45 municipalities’ plans were approved in 2008,
               it reached 596 in 2020.

                Graph 51  Number of Municipalities with Approved Packaging Waste Management Plan (2020 Packaging Bulletin,
                         MoEUCC, 2022)

                                                                                                  596
                                                                                           588
                                                                                     478
                                                                              310
                                                                        303
                                                                 303
                                                          267
                                                   229
                   45    120    165   197    211
                 2008   2009  2010   2011   2012   2013  2014   2015   2016   2017  2018   2019   2020


               Municipalities are obliged to collect or have packaging wastes collected according to the By-
               law. In order to carry out these activities, they prepare and submit their packaging waste ma-
               nagement plans to the MoEUCC in order to specify by whom, how, in what way and when the
               accumulation, collection and transport of packaging wastes separately from other wastes at the
               source will be carried out. These studies, which were initiated for the first time in 2008, continue.

               The results obtained from the users who entered data into the packaging information system
               regarding packaging production, amounts and rates of packaging placed on the market based
               on intended use, amounts and recovery rates of packaging waste recovered are given in the
               following Table and Graphic.


                Table 73  2020 Packaging and Packaging Waste Statistics Results  (MoEUCC, (Packaging and Packaging Waste Bulletin
                         2020, 2022), 2022)
                                                      Within the Scope of B-1 1  Released to
                                      Packaging                                               Covered
                 Waste      Type      Produced                                    the Market   under C 3
                  Code                          Released to   Recovered  Realized   under B-2
                                                                                         2
                                      (tonnes)   the Market            Recovery    (tonnes)   (tonnes)
                                                 (tonnes)   (tonnes)    Rate (%)
                15.01.02 Plastic       2,870,185   926,551    615,988     66         99,540      15,755

                15.01.04 Metal          525,627    129,545     72,666     56         73,503      15,828
                15.01.05 Composite      273,495     95,412     66,973     70          9,159         26

                         Paper
                15.01.01               3,260,126  1,198,603  1,079,857    90         28,820      11,550
                         Cardboard
                15.01.07 Glass         1,742,759   802,067    242,226     30         65,428     109,339
                15.01.03 Wood           776,551    555,152    222,714     40          2,026      98,500

                         Total         9,448,743  3,707,329  2,300,425    62         278,476    250,998

               1)  B-1: Packages whose disposal is carried out within the framework of the PWC By-law
               2) B-2: Packages whose disposal is carried out within the framework of legislation other than the PWC By-law
               3) C: Packages placed on the market with deposit under the PWC By-law


          220