
Page 178 - Çevre Şehir ve İklim Dergisi İngilizce - Özel Sayı
P. 178
Determination of Potential Avalanche Release Areas, Avalanche Mobile Application and
Preparation of Avalanche Hazard Maps in Türkiye; the Case of Palandöken Ski Centre
• Digital elevation model (DTM) with 5 X 5 resolution
• Active and potential avalanche starting zones acquired through land
analyses and the algorithms used
• Density (kg/m³): 300,
• Law of Friction: Voellmy Model,
• Return Period: 100 years,
• The avalanche size: large
• Fracture depth: Due to the lack of data from the Palandöken Ski Resort
meteorological station, it could not be used in the study. To determine
the fracture depth in the starting zone, the approach from Schellander’s
(2004) study in the Austrian Alps was adopted, and the 100-year fracture
depth was taken as 1.6 meters.
• Friction Parameters: Automatically marked.
Countries like Sweden, Austria and France use color scale while creating
avalanche hazard maps. The color scale is determined based on the pressure
values acquired from the two dimensional avalanche simulation results, and
the mapping is made based on these data.
For instance, as seen in Figure 10, areas in Austria with avalanche pressures
ranging between 1 and 10 kN/m² are displayed in yellow, while regions with
pressure values of 10 kN/m² and above are indicated in red. This color scale
makes the level of avalanche hazard visually more understandable, enabling
users to easily assess the risks.
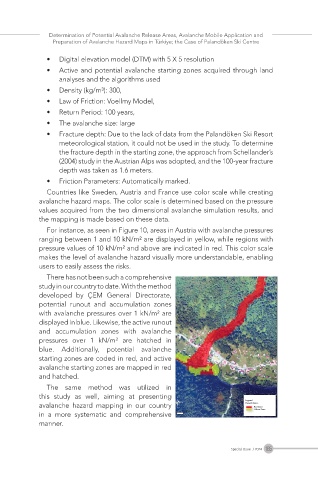
There has not been such a comprehensive
study in our country to date. With the method
developed by ÇEM General Directorate,
potential runout and accumulation zones
with avalanche pressures over 1 kN/m² are
displayed in blue. Likewise, the active runout
and accumulation zones with avalanche
pressures over 1 kN/m² are hatched in
blue. Additionally, potential avalanche
starting zones are coded in red, and active
avalanche starting zones are mapped in red
and hatched.
The same method was utilized in
this study as well, aiming at presenting
avalanche hazard mapping in our country
in a more systematic and comprehensive
manner.
165
Special Issue / 2024