
Page 62 - Çevre Şehir İklim İngilizce - Sayı 4
P. 62
Urban Transformation Forecasts with Artificial Intelligence
Based Algorithms
Two different scenarios were tried at the stage of dividng the data into
training, verification and test sets. In the first scenario, data was divided into
series. In other words, the first 13 years of the 19-year data set in total was
prepared for use in the training of models, the next three years of data for
verification of models, and the remaining three years of data set for use in the
testing phase of models. As a result of the preliminary analyses, the desired
accuracy results could not be obtained from the test data set due to the fact
that the data reached peak values especially in recent years. In the second
scenario, mixed selection of data was prefered. In this scenario, in order for
all years to be represented in the training, verification and test data sets, the
first three periods of the first year were chosen for the training, final period
for the verification period and the first period of the next year for the test
data set. This series were continued and it was ensured that different periods
from each year were included in the training, verification and test data sets.
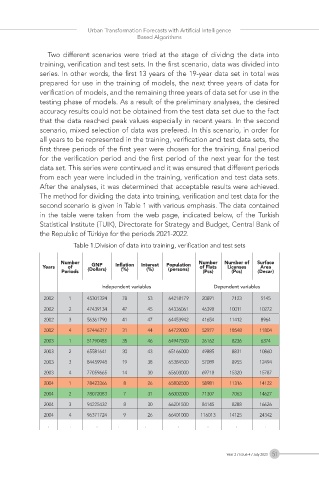
After the analyses, it was determined that acceptable results were achieved.
The method for dividing the data into training, verification and test data for the
second scenario is given in Table 1 with various emphasis. The data contained
in the table were taken from the web page, indicated below, of the Turkish
Statistical Institute (TUIK), Directorate for Strategy and Budget, Central Bank of
the Republic of Türkiye for the periods 2021-2022.
Table 1.Division of data into training, verification and test sets
Number GNP Inflation Interest Population Number Number of Surface
Years of (Dollars) (%) (%) (persons) of Flats Licenses Area
Periods (Pcs) (Pcs) (Decar)
Independent variables Dependent variables
2002 1 45301324 78 53 64218179 20891 7123 5145
2002 2 47439134 47 45 64336061 46398 10011 10272
2002 3 56361790 41 47 64453942 41654 11412 8964
2002 4 57446317 31 44 64729000 52977 18548 11804
2003 1 51790485 35 46 64947500 26162 8236 6374
2003 2 65581641 30 43 65166000 49885 8831 10860
2003 3 84459948 19 38 65384500 57089 8955 12494
2003 4 77059665 14 30 65603000 69718 15320 15787
2004 1 78423366 8 26 65802500 58981 11316 14122
2004 2 78072083 7 31 66002000 71307 7063 14627
2004 3 94225432 8 30 66201500 84145 8288 16626
2004 4 96371724 9 26 66401000 116013 14125 24342
. . . . . . . . .
Year 2 / Issue 4 / July 2023 51