
Page 128 - Çevre Şehir İklim İngilizce - Sayı 3
P. 128
Causes of Mucilage Formation and Solution Suggestions in
The Light of Mucilage Composition Findings in The Sea of Marmara
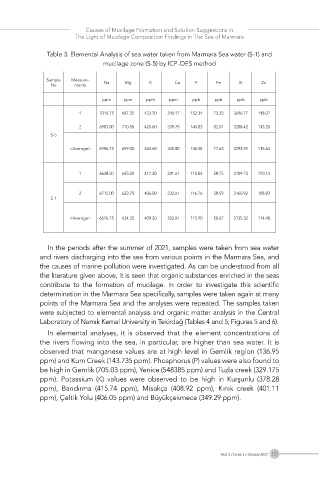
Table 3. Elemental Analysis of sea water taken from Marmara Sea water (S-1) and
mucilage zone (S-5) by ICP-OES method
Sample Measure-
No ments Na Mg K Ca P Fe B Zn
ppm ppm ppm ppm ppb ppb ppb ppb
1 7010.75 687.25 423.70 340.17 152.34 73.25 3296.77 118.07
2 6983.00 710.50 425.60 339.75 140.83 82.01 3288.42 113.20
S-5
<Average> 6996.75 699.00 424.60 340.00 146.58 77.63 3292.59 115.64
1 6638.50 645.00 412.30 331.61 115.04 58.75 3109.73 120.14
2 6715.00 623.75 406.00 332.61 116.76 58.59 3160.92 108.83
S-1
<Average> 6676.75 634.25 409.20 332.01 115.90 58.67 3135.32 114.48
In the periods after the summer of 2021, samples were taken from sea water
and rivers discharging into the sea from various points in the Marmara Sea, and
the causes of marine pollution were investigated. As can be understood from all
the literature given above, it is seen that organic substances enriched in the seas
contribute to the formation of mucilage. In order to investigate this scientific
determination in the Marmara Sea specifically, samples were taken again at many
points of the Marmara Sea and the analyses were repeated. The samples taken
were subjected to elemental analysis and organic matter analysis in the Central
Laboratory of Namık Kemal University in Tekirdağ (Tables 4 and 5; Figures 5 and 6).
In elemental analyses, it is observed that the element concentrations of
the rivers flowing into the sea, in particular, are higher than sea water. It is
observed that manganese values are at high level in Gemlik region (136.95
ppm) and Kum Creek (143.735 ppm). Phosphorus (P) values were also found to
be high in Gemlik (705.03 ppm), Yenice (548385 ppm) and Tuzla creek (329.175
ppm). Potassium (K) values were observed to be high in Kurşunlu (378.28
ppm), Bandırma (415.74 ppm), Misakça (408.92 ppm), Kınık creek (401.11
ppm), Çeltik Yolu (406.05 ppm) and Büyükçekmece (349.29 ppm).
Year 2 / Issue 3 / January 2023 113