
Page 124 - 7. State Of Environment Report Of Türkiye
P. 124
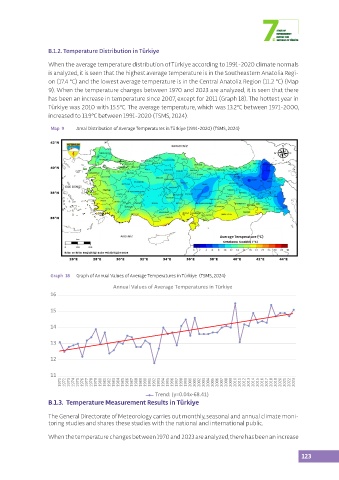
B.1.2. Temperature Distribution in Türkiye

                  When the average temperature distribution of Türkiye according to 1991-2020 climate normals
                  is analyzed, it is seen that the highest average temperature is in the Southeastern Anatolia Regi-
                  on (17.4 °C) and the lowest average temperature is in the Central Anatolia Region (11.2 °C) (Map
                  9). When the temperature changes between 1970 and 2023 are analyzed, it is seen that there
                  has been an increase in temperature since 2007, except for 2011 (Graph 18). The hottest year in
                  Türkiye was 2010 with 15.5°C. The average temperature, which was 13.2°C between 1971-2000,
                  increased to 13.9°C between 1991-2020 (TSMS, 2024).

                   Map  9   Areal Distribution of Average Temperatures in Türkiye (1991-2020) (TSMS, 2024)


                                                                              Average Temperature ( C)
                                                                                            o


                   Graph  18  Graph of Annual Values of Average Temperatures in Türkiye  (TSMS, 2024)
                                         Annual Values of Average Temperatures in Türkiye
                   16

                   15


                   14

                   13


                   12

                   11
                      1971  1972  1973  1974  1975  1976  1977  1978  1979  1980  1981  1982  1983  1984  1985  1986  1987  1988  1989  1990  1991  1992  1993  1994  1995  1996  1997  1998  1999  2000  2001  2002  2003  2004  2005  2006  2007  2008  2009  2010  2011  2012  2013  2014  2015  2016  2017  2018  2019  2020  2021  2022  2023

                                                        Trend: (y=0.04x-68.41)
                  B.1.3.  Temperature Measurement Results in Türkiye

                  The General Directorate of Meteorology carries out monthly, seasonal and annual climate moni-
                  toring studies and shares these studies with the national and international public.

                  When the temperature changes between 1970 and 2023 are analyzed, there has been an increase


                                                                                                           123