
Page 68 - 7. State Of Environment Report Of Türkiye
P. 68
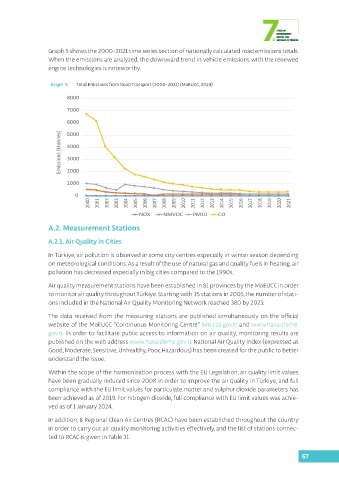
Graph 5 shows the 2000-2021 time series section of nationally calculated road emissions totals.
                  When the emissions are analyzed, the downward trend in vehicle emissions with the renewed
                  engine technologies is noteworthy.


                   Graph  5  Total Emissions from Road Transport (2000-2021) (MoEUCC, 2024)
                         8000

                         7000

                         6000

                         5000
                      Emissions [ktonnes]  4000


                         3000

                         2000
                        1000

                           0
                                2000  2001  2002  2003  2004  2005  2006  2007  2008  2009  2010  2011  2012  2013  2014  2015  2016  2017  2018  2019  2020  2021
                                                  NOX     NMVOC      PM10     CO

                  A.2. Measurement Stations

                  A.2.1. Air Quality in Cities

                  In Türkiye, air pollution is observed in some city centres especially in winter season depending
                  on meteorological conditions. As a result of the use of natural gas and quality fuels in heating, air
                  pollution has decreased especially in big cities compared to the 1990s.

                  Air quality measurement stations have been established in 81 provinces by the MoEUCC in order
                  to monitor air quality throughout Türkiye. Starting with 35 stations in 2005, the number of stati-
                  ons included in the National Air Quality Monitoring Network reached 380 by 2023.
                  The data received from the measuring stations are published simultaneously on the official
                  website of the MoEUCC “Continuous Monitoring Centre” sim.csb.gov.tr and www.havaizleme.
                  gov.tr. In order to facilitate public access to information on air quality, monitoring results are
                  published on the web address www.havaizleme.gov.tr. National Air Quality Index (expressed as
                  Good, Moderate, Sensitive, Unhealthy, Poor, Hazardous) has been created for the public to better
                  understand the issue.

                  Within the scope of the harmonisation process with the EU Legislation, air quality limit values
                  have been gradually reduced since 2008 in order to improve the air quality in Türkiye, and full
                  compliance with the EU limit values for particulate matter and sulphur dioxide parameters has
                  been achieved as of 2019. For nitrogen dioxide, full compliance with EU limit values was achie-
                  ved as of 1 January 2024.

                  In addition, 8 Regional Clean Air Centres (RCAC) have been established throughout the country
                  in order to carry out air quality monitoring activities effectively, and the list of stations connec-
                  ted to RCAC is given in Table 31.


                                                                                                           67