
Page 67 - 7. State Of Environment Report Of Türkiye
P. 67
Under the umbrella of the Convention and Protocol, “Country Review” meetings are organised
every 5 years for regular country reporting, and since 2012, reviews for Türkiye have been carried
out by the Convention Task Forces in 2012, 2016 and 2019.
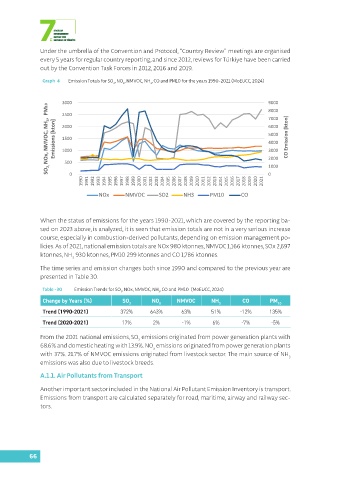
Graph 4 Emission Totals for SO , NO , NMVOC, NH , CO and PM10 for the years 1990-2021 (MoEUCC, 2024)
2 X 3
3000 9000
SO 2, NOx, NMVOC, NH 3 , PM10 Emissions [kton] 2000 6000 CO Emission [kton]
8000
2500
7000
5000
1500
4000
1000
3000
2000
500
0
0
1990 1991 1992 1993 1994 1995 1996 1997 1998 1999 2000 2001 2002 2003 2004 2005 2006 2007 2008 2009 2010 2011 2012 2013 2014 2015 2016 2017 2018 2019 2020 2021 1000
NOx NMVOC SO2 NH3 PM10 CO
When the status of emissions for the years 1990-2021, which are covered by the reporting ba-
sed on 2023 above, is analyzed, it is seen that emission totals are not in a very serious increase
course, especially in combustion-derived pollutants, depending on emission management po-
licies. As of 2021, national emission totals are NOx 980 ktonnes, NMVOC 1,166 ktonnes, SOx 2,697
ktonnes, NH 930 ktonnes, PM10 299 ktonnes and CO 1,786 ktonnes.
3
The time series and emission changes both since 1990 and compared to the previous year are
presented in Table 30.
Table -30 Emission Trends for SO , NOx, NMVOC, NH , CO and PM10 (MoEUCC, 2024)
2 3
Change by Years (%) SO 2 NO X NMVOC NH 3 CO PM 10
Trend (1990-2021) 372% 643% 63% 51% -12% 135%
Trend (2020-2021) 17% 2% -1% 6% -7% -5%
From the 2021 national emissions, SO emissions originated from power generation plants with
2
68.6% and domestic heating with 13.9%. NO emissions originated from power generation plants
x
with 37%. 21.7% of NMVOC emissions originated from livestock sector. The main source of NH
3
emissions was also due to livestock breeds.
A.1.1. Air Pollutants from Transport
Another important sector included in the National Air Pollutant Emission Inventory is transport.
Emissions from transport are calculated separately for road, maritime, airway and railway sec-
tors.
66