
Page 159 - 7. State Of Environment Report Of Türkiye
P. 159
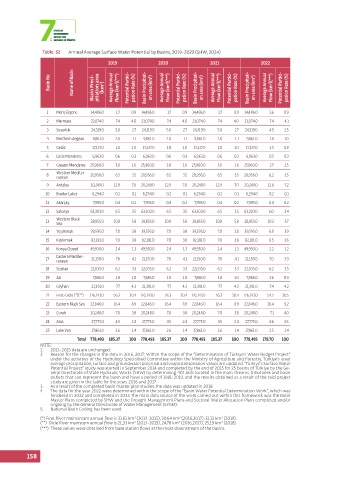
Table  52  Annual Average Surface Water Potential by Basins, 2019-2023 (SHW, 2024)
                                       2019              2020              2021              2022

                  Basin No  Name of Basin  Basin Preci-  pitation area   (km 2 )  Average Annual   Flow (km 3 )(***)  Potential Partici-  pation Rate (%)  Basin Precipitati-  on area (km 2 )  Average Annual   Flow (km 3 )(***)  Potential Partici-  pation Rate (%)  Basin Precipitati-  on area (km 2 )  Average Annual   Flow (km 3 )(***)  Potential Partici-  pation Rate (%)  Basin Precipitati-  on area (km 2 )  Average Annual   Flow (km 3 )(***)  Potential Partici-  pation R


                 1   Meriç Ergene  14,486.0  1.7  0.9  14,486.0  1.7  0.9  14,486.0  1.7  0.9  14,486.0  1.6  0.9
                 2   Marmara     23,074.0  7.4  4.0  23,074.0  7.4  4.0  23,074.0  7.4  4.0  23,074.0  7.4  4.1
                 3   Susurluk    24,319.0  5.0  2.7  24,319.0  5.0  2.7  24,319.0  5.0  2.7  24,319.0  4.5  2.5
                 4   Northern Aegean  9,861.0  2.0  1.1  9,861.0  2.0  1.1  9,861.0  2.0  1.1  9,861.0  1.8  1.0
                 5   Gediz       17,137.0  1.8  1.0  17,137.0  1.8  1.0  17,137.0  1.8  1.0  17,137.0  1.5  0.8
                 6   Little Menderes  6,963.0  0.6  0.3  6,963.0  0.6  0.3  6,963.0  0.6  0.3  6,963.0  0.5  0.3
                 7   Greater Menderes  25,960.0  3.0  1.6  25,960.0  3.0  1.6  25,960.0  3.0  1.6  25,960.0  2.7  1.5
                     Western Mediter-
                 8               20,956.0  6.5  3.5  20,956.0  6.5  3.5  20,956.0  6.5  3.5  20,956.0  6.2  3.5
                     ranean
                 9   Antalya     20,249.0  12.9  7.0  20,249.0  12.9  7.0  20,249.0  12.9  7.0  20,249.0  12.8  7.2
                 10  Burdur Lakes  6,294.0  0.2  0.1  6,294.0  0.2  0.1  6,294.0  0.2  0.1  6,294.0  0.2  0.1
                 11  Akarçay      7,995.0  0.4  0.2  7,995.0  0.4  0.2  7,995.0  0.4  0.2  7,995.0  0.4  0.2
                 12  Sakarya     63,303.0  6.5  3.5  63,303.0  6.5  3.5  63,303.0  6.5  3.5  63,303.0  6.0  3.4
                 13  Western Black   28,855.0  10.8  5.8  28,855.0  10.8  5.8  28,855.0  10.8  5.8  28,855.0  10.3  5.7
                     Sea
                 14  Yeşılırmak  39,595.0  7.0  3.8  39,595.0  7.0  3.8  39,595.0  7.0  3.8  39,595.0  6.9  3.9
                 15  Kızılırmak  82,181.0  7.0  3.8  82,181.0  7.0  3.8  82,181.0  7.0  3.8  82,181.0  6.5  3.6
                 16  Konya Closed  49,930.0  2.4  1.3  49,930.0  2.4  1.3  49,930.0  2.4  1.3  49,930.0  2.2  1.2
                     Eastern Mediter-
                 17              21,150.0  7.6  4.1  21,150.0  7.6  4.1  21,150.0  7.6  4.1  21,150.0  7.0  3.9
                     ranean
                 18  Seyhan      22,035.0  6.2  3.3  22,035.0  6.2  3.3  22,035.0  6.2  3.3  22,035.0  6.2  3.5
                 19  Asi          7,886.0  1.8  1.0  7,886.0  1.8  1.0  7,886.0  1.8  1.0  7,886.0  1.6  0.9
                 20  Ceyhan      21,391.0  7.7  4.2  21,391.0  7.7  4.2  21,391.0  7.7  4.2  21,391.0  7.4  4.2
                 21  Fırat-Dicle (*)(**)  176,143.0  56.3  30.4 176,143.0  56.3  30.4 176,143.0  56.3  30.4  176,143.0  54.5  30.5
                 22  Eastern Black Sea  22,846.0  16.4  8.9  22,846.0  16.4  8.9  22,846.0  16.4  8.9  22,846.0  16.4  9.2
                 23  Çoruh       20,248.0  7.0  3.8  20,248.0  7.0  3.8  20,248.0  7.0  3.8  20,248.0  7.1  4.0
                 24  Aras        27,775.0  4.5  2.4  27,775.0  4.5  2.4  27,775.0  4.5  2.4  27,775.0  4.6  2.6
                 25  Lake Van    17,861.0  2.6  1.4  17,861.0  2.6  1.4  17,861.0  2.6  1.4  17,861.0  2.5  1.4
                            Total 778,493  185.37  100 778,493  185.37  100 778,493  185.37  100  778,493  178.70  100
               NOTE:
               1.   2013-2015 data are unchanged.
               2.   Reason for the changes in the data in 2016, 2017; Within the scope of the “Determination of Türkiye’s Water Budget Project”
                   under the activities of the Hydrology Specialised Committee within the Ministry of Agriculture and Forestry, Türkiye’s areal
                   average precipitation, surface and groundwater potential and evapotranspiration values are updated. “Türkiye’s Surface Water
                   Potential Project” study was started in September 2014 and completed by the end of 2015 for 25 basins of Türkiye by the Ge-
                   neral Directorate of State Hydraulic Works (SHW) by determining 401 AGIs located in the main streams, tributaries and basin
                   outlets that can represent the basin and have a period of 1981-2010, and the results obtained as a result of the said project
                   study are given in the table for the years 2016 and 2017.
               3.   As a result of the completed basin master plan studies, the data was updated in 2018.
               4.   The data for the year 2022 were determined within the scope of the “Basin Water Potential Determination Work”, which was
                   tendered in 2022 and completed in 2023. The main data source of the work carried out within this framework was the Basin
                   Master Plans completed by SHW and the Drought Management Plans and Sectoral Water Allocation Plans completed and/or
                   ongoing by the General Directorate of Water Management (SYGM).
               5.   National Basin Coding has been used.
               (*) Fırat River mainstream annual flow is 31.61 km  (2013-2015), 30.64 km  (2016,2017), 31.13 km  (2018).
                                                3
                                                                3
                                                                               3
               (**)  Dicle River mainstem annual flow is 21,33 km  (2013-2015), 24,78 km  (2016,2017), 25,19 km  (2018).
                                                                3
                                                                               3
                                                3
               (***)  These values were obtained from base station flows at the most downstream of the basins.
           158