Page 112 - 7. State Of Environment Report Of Türkiye
P. 112

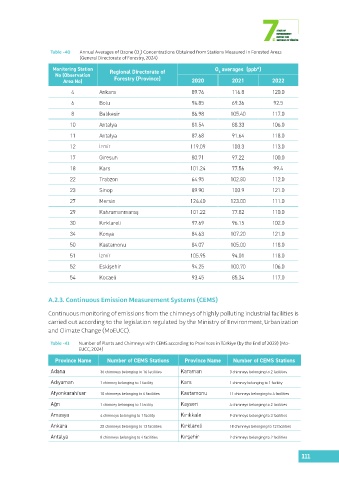
Table -40  Annual Averages of Ozone (O ) Concentrations Obtained from Stations Measured in Forested Areas
                                                  3
                             (General Directorate of Forestry, 2024)
                    Monitoring Station   Regional Directorate of             O  averages  (ppb*)
                    No (Observation                                           3
                       Area No)          Forestry (Province)        2020          2021           2022
                          4         Ankara                          89.76         116.8          120.0

                          6         Bolu                            94.85         69.36          92.5
                          8         Balıkesir                       86.98         105.40         117.0

                          10        Antalya                         81.54         88.33          106.0
                          11        Antalya                         87.68         91.64          118.0
                          12        İzmir                           119.09        103.3          113.0

                          17        Giresun                         80.71         97.22          100.0
                          18        Kars                            101.24        77.56          99.4
                          22        Trabzon                         64.95         102.80         112.0

                          23        Sinop                           89.90         103.9          121.0
                          27        Mersin                          124.40        123.00         111.0

                          29        Kahramanmaraş                   101.22        77.82          110.0
                          30        Kırklareli                      97.69         96.15          102.0
                          34        Konya                           84.63         107.20         121.0

                          50        Kastamonu                       84.07         105.00         118.0
                          51        İzmir                           105.95        94.01          118.0

                          52        Eskişehir                       94.25         100.70         106.0
                          54        Kocaeli                         93.45         85.34          117.0


                  A.2.3. Continuous Emission Measurement Systems (CEMS)

                  Continuous monitoring of emissions from the chimneys of highly polluting industrial facilities is
                  carried out according to the legislation regulated by the Ministry of Environment, Urbanization
                  and Climate Change (MoEUCC).
                   Table -41  Number of Plants and Chimneys with CEMS according to Provinces in Türkiye (by the End of 2023) (Mo-
                             EUCC, 2024)
                    Province Name      Number of CEMS Stations    Province Name    Number of CEMS Stations

                   Adana            36 chimneys belonging to 16 facilities  Karaman  3 chimneys belonging to 2 facilities
                   Adıyaman         1 chimney belonging to 1 facility  Kars       1 chimney belonging to 1 facility
                   Afyonkarahisar   10 chimneys belonging to 6 facilities  Kastamonu  11 chimneys belonging to 4 facilities

                   Ağrı             1 chimney belonging to 1 facility  Kayseri    4 chimneys belonging to 2 facilities
                   Amasya           4 chimneys belonging to 1 facility  Kırıkkale  9 chimneys belonging to 3 facilities
                   Ankara           25 chimneys belonging to 13 facilities  Kırklareli  18 chimneys belonging to 12 facilities

                   Antalya          8 chimneys belonging to 4 facilities  Kırşehir  2 chimneys belonging to 2 facilities


                                                                                                           111
   107   108   109   110   111   112   113   114   115   116   117