
Page 169 - 7. State Of Environment Report Of Türkiye
P. 169
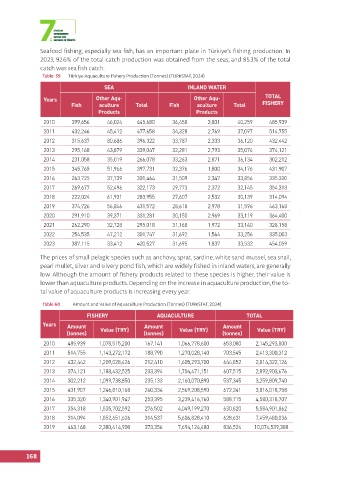
Seafood fishing, especially sea fish, has an important place in Türkiye’s fishing production. In
               2023, 92.6% of the total catch production was obtained from the seas, and 85.3% of the total
               catch was sea fish catch.
                Table  59  Türkiye Aquaculture Fishery Production (Tonnes) (TURKSTAT, 2024)
                                      SEA                          INLAND WATER

                Years              Other Aqu-                        Other Aqu-               TOTAL
                          Fish      aculture     Total      Fish      aculture     Total     FISHERY
                                    Products                          Products
                2010      399,656      46,024    445,680      36,458      3,801     40,259      485,939
                2011      432,246      45,412    477,658      34,328      2,769     37,097      514,755
                2012      315,637      80,686    396,322      33,787      2,333     36,120      432,442
                2013      295,168      43,879    339,047      32,281      2,793     35,074      374,121
                2014      231,058      35,019    266,078      33,263      2,871     36,134      302,212
                2015      345,765      51,966    397,731      32,376      1,800     34,176      431,907
                2016      263,725      37,739    301,464      31,509      2,347     33,856      335,320
                2017      269,677      52,496    322,173      29,773      2,372     32,145      354,318
                2018      222,024      61,931    283,955      27,607      2,532     30,139      314,094
                2019      374,726      56,846    431,572      28,618      2,978     31,596      463,168
                2020      291,910       39,371   331,281      30,150      2,969     33,119      364,400
                2021      262,290      32,728    295,018      31,168      1,972     33,140      328,158

                2022       254,535     47,212    301,747      31,692      1,564     33,256      335,003
                2023      387,115      33,412    420,527      31,695      1,837     33,532      454,059

               The prices of small pelagic species such as anchovy, sprat, sardine, white sand mussel, sea snail,
               pearl mullet, silver and silvery pond fish, which are widely fished in inland waters, are generally
               low. Although the amount of fishery products related to these species is higher, their value is
               lower than aquaculture products. Depending on the increase in aquaculture production, the to-
               tal value of aquaculture products is increasing every year.

                Table 60   Amount and Value of Aquaculture Production (Tonnes) (TURKSTAT, 2024)
                                FISHERY                 AQUACULTURE                     TOTAL
                Years    Amount                     Amount                     Amount
                        (tonnes)    Value (TRY)     (tonnes)    Value (TRY)    (tonnes)    Value (TRY)
                2010     485,939    1,078,515,200   167,141     1,066,778,600  653,080     2,145,293,800
                2011     514,755    1,143,272,172   188,790     1,270,028,140  703,545     2,413,300,312

                2012     432,442    1,209,028,426   212,410     1,605,293,700  644,852     2,814,322,126
                2013     374,121    1,188,432,525   233,394     1,704,471,151  607,515     2,892,903,676
                2014     302,212    1,099,738,850   235,133     2,160,070,890  537,345     3,259,809,740
                2015     431,907    1,246,810,168   240,334     2,569,208,590  672,241     3,816,018,758
                2016     335,320    1,340,901,947   253,395     3,239,416,760  588,715     4,580,318,707
                2017     354,318    1,535,702,592   276,502     4,049,199,270  630,820     5,584,901,862
                2018     314,094    1,852,651,626   314,537     5,606,828,410  628,631     7,459,480,036
                2019     463,168    2,380,414,908   373,356     7,694,124,480  836,524    10,074,539,388


          168